
We added a new variable called Total Users. It computes the total number of users for a project, independent of the time range or filters you've applied. You can use it inside custom variables.
One thing to note: only tags are available as a breakdown. If you use Total Users alongside another grouping (for example, by topic), the value displayed will always be the total users for the entire project, not filtered by that group.
You can now generate AI summaries in different languages. To change the language, go to your project settings and select "Summary Language." This opens a dialog where you choose the language for all AI summaries in that project.

You can now track input and output token consumption directly in the report section and interaction table.
Add the "Input Token" and "Output Token" variables to your charts to monitor LLM trace data.
Note: these values come from what's passed through the Interaction API, so if they aren't provided there, they'll appear as 0.
A new chart variable is now available to measure output length in characters, allowing users to track how verbose model responses are over time.
A new failure category has been added that automatically groups all interactions receiving a thumbs down into a dedicated category for easier analysis and reporting.
Users can now define custom variables when creating or editing a chart.
Custom variables support mathematical formulas, allowing customers to express calculations that were not possible with built-in variables. Formulas can reference both built-in and custom variables, and filters can be applied as usual, enabling businesses to track their metrics that matter most to their usage.
We've launched a native integration that lets teams ingest Langfuse observability data directly into Nebuly for user analytics.
What's new:
- Full integration option: Nebuly automatically pulls traces from your Langfuse account daily (interval configurable). API keys are securely stored in encrypted vaults.
- Local integration option: Use open-source Python scripts to extract and transform data in your own infrastructure. Full control over data residency and enrichment.
- Seamless data flow: No changes to your existing Langfuse instrumentation. Traces flow automatically to Nebuly for user intent, sentiment, and adoption analysis.
- Tag-based segmentation: Use Langfuse tags to add user context (segment, geography, cohort, role). Analyze adoption by any dimension that matters.
Get started:
Integration documentation
Open-source integration scripts
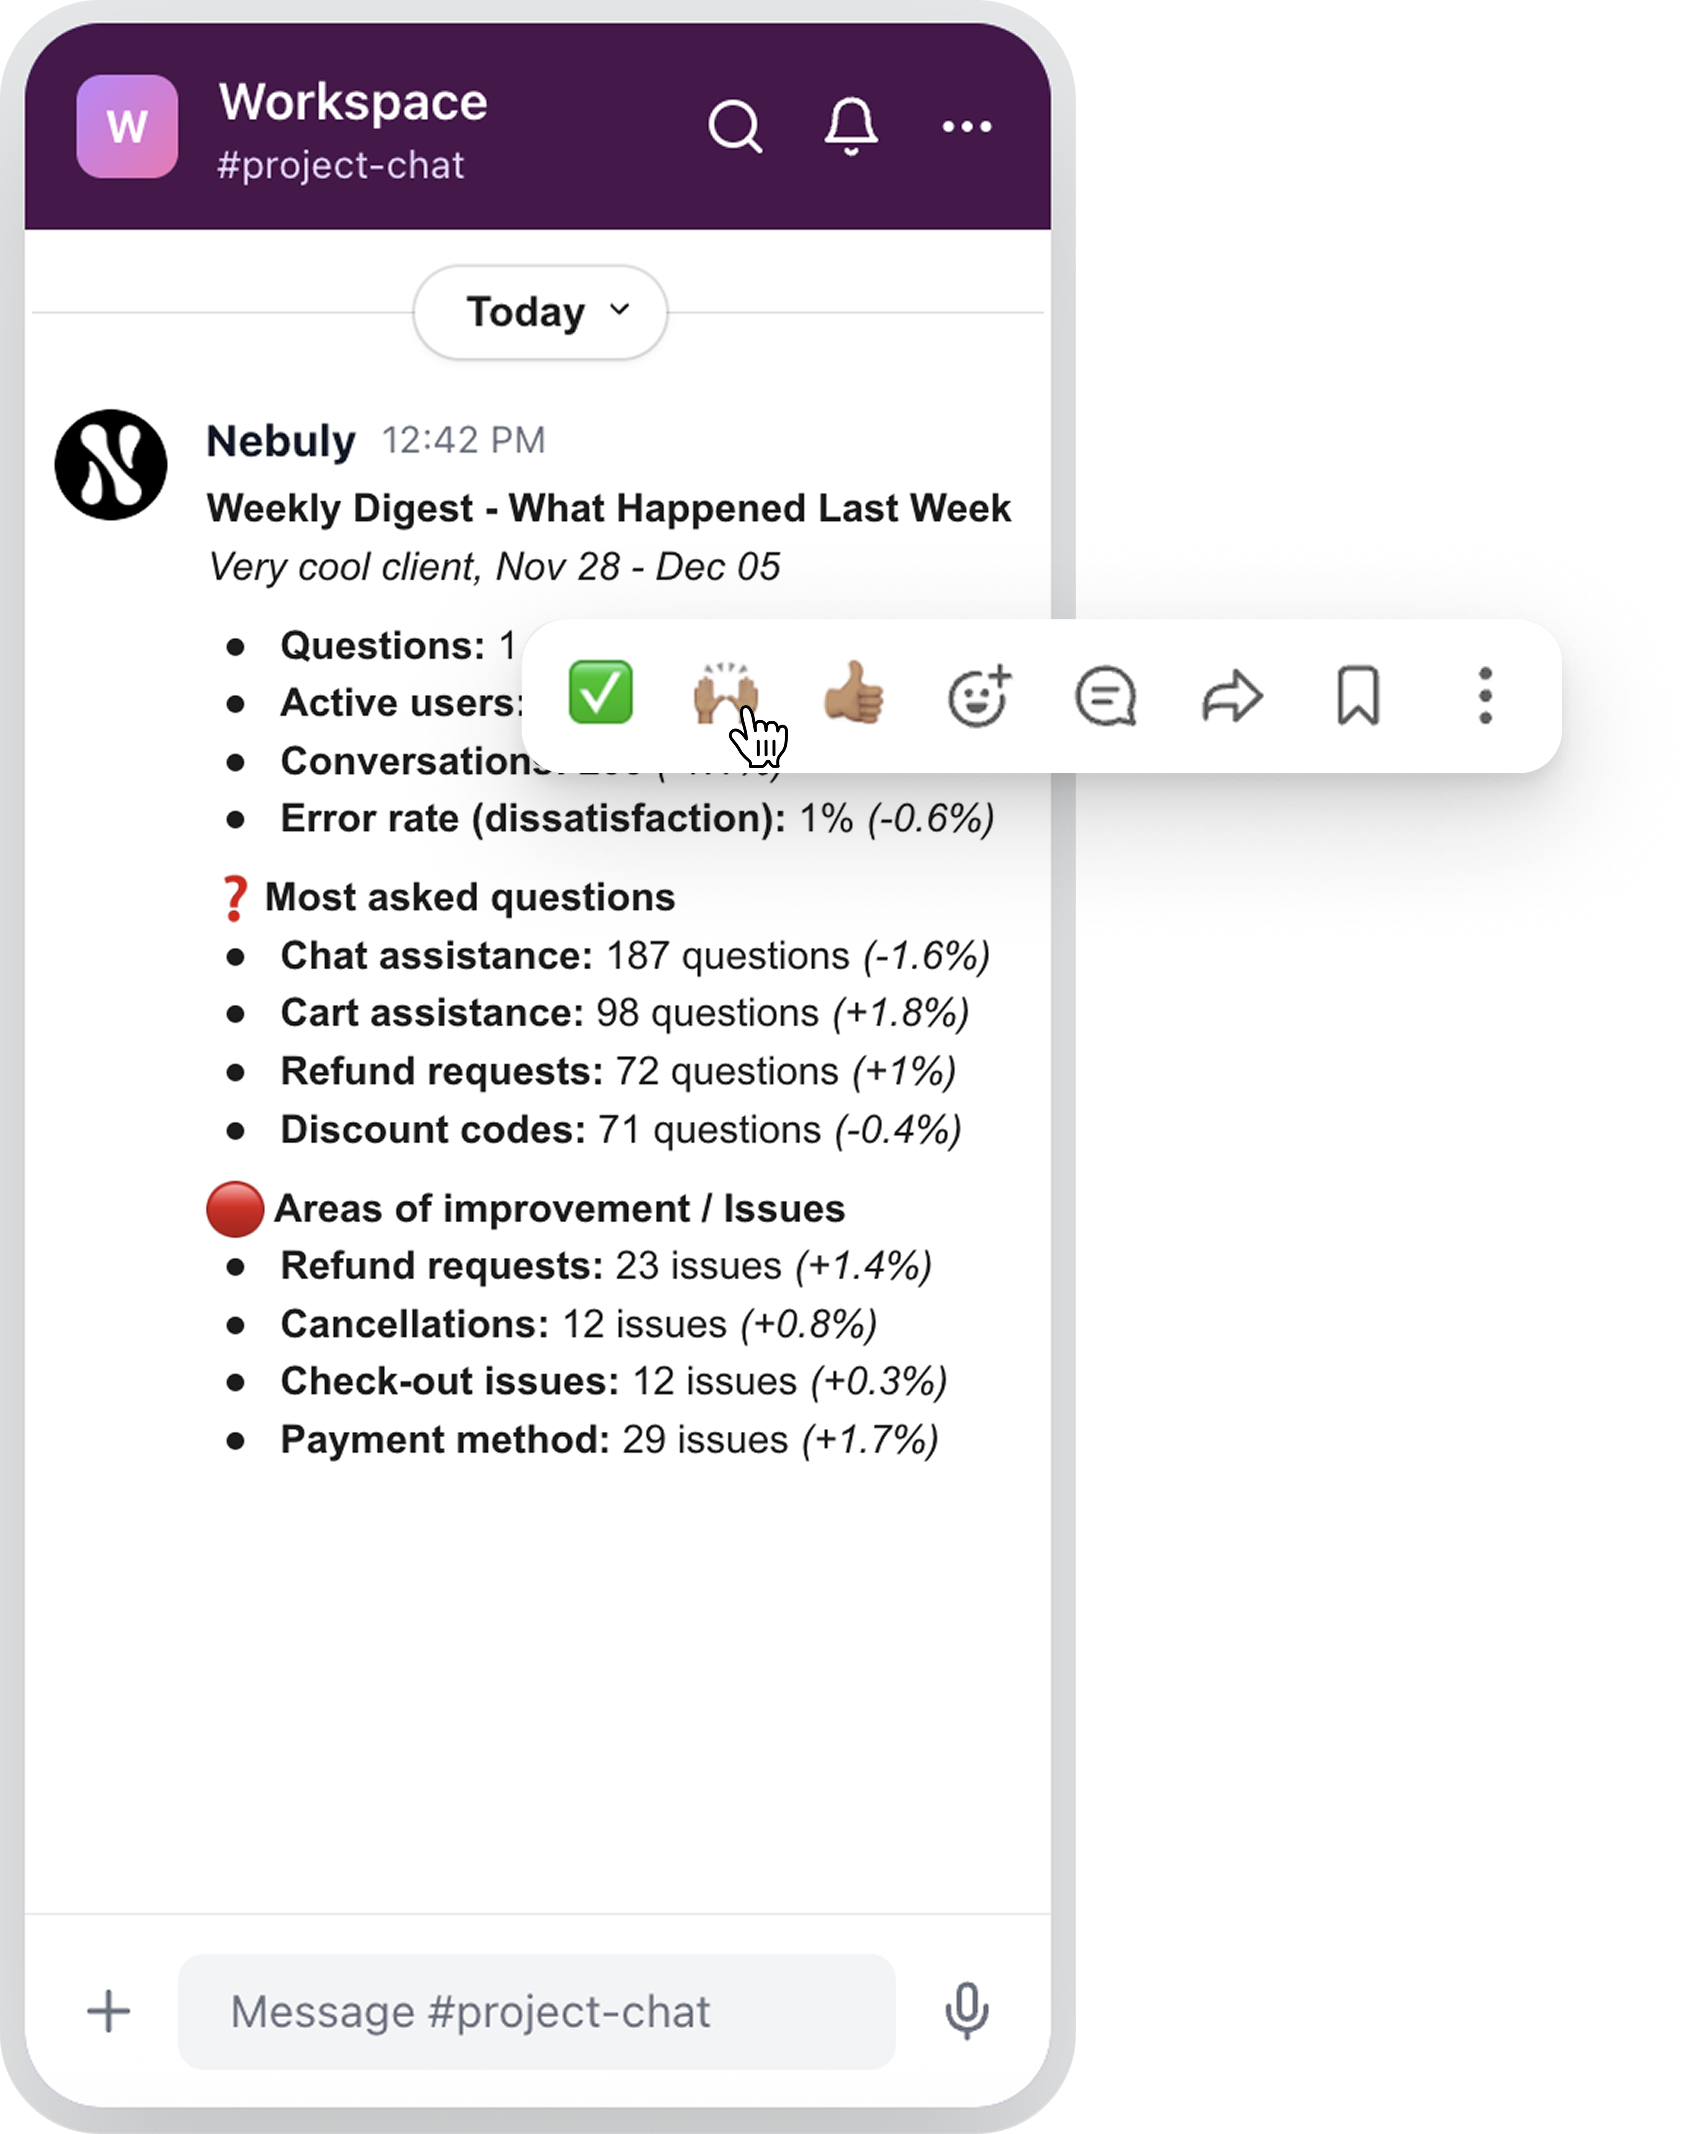
You can now get a weekly summary of key metrics directly in Slack (or Teams / email).
The digest shows number of questions, active users, total conversations, error rate or dissatisfaction rate and other main events, so you always have a quick, up-to-date overview of what’s happening inside your chatbot.
We introduced a central place to create new elements inside your project.
You can now add charts, reports, custom topics, business risks, chatbot issues, and more from one unified entry point, in the left sidebar.
You can now select both date and time in the custom date filter. Until now, filtering was limited to full days.
This gives you sharper visibility into specific moments of the day, helping you spot patterns like afternoon spikes or late-evening drop-offs.
Our summary view continues to improve. It brings all user-LLM interactions together in a cleaner, more digestible format, making it easier to spot patterns and understand what is happening at a glance.
You can now rename automatically generated entities to match your product language.
This includes:
• Topics
• Actions
• Failure Intelligence categories
This update is particularly useful for teams with domain-specific terminology or internal taxonomies. The new rename option appears directly in the interface for quick updates.
Filters and chart variables now include descriptive tooltips. This helps teams understand each metric and apply filters with confidence.
We added a new search function that lets users find any insight across Nebuly, from interactions to topics or intents, without needing to know where it lives.
This empowers new teams to explore insights more intuitively. With the new search bar in the left navigation, anyone can simply type a topic or keyword (e.g.: “credit card”) and instantly see every related mention across interactions, topics, and intents, with no prior training needed.
.png)
We’re introducing the option to save favorite filters directly in dashboards. This helps users quickly return to their preferred views, for example, a combination of tags or metrics they monitor often.
You can now create custom user groups to analyze and compare how different types of users engage with your product.
This feature lets you filter and segment users based on behavioral patterns, such as conversation frequency, interaction depth, or active time windows, and then study how these groups behave over time.
💡 Example use cases:
- Group “light users” (1–2 conversations, <5 turns each) to understand drop-off causes.
- Identify “deep users” with multiple, long sessions to see what drives engagement.
- Analyze morning vs. afternoon users to uncover time-based usage patterns.
By creating user groups, teams can profile users more accurately, spot emerging trends, and prioritize improvements that increase retention and engagement. Click here to try it out.
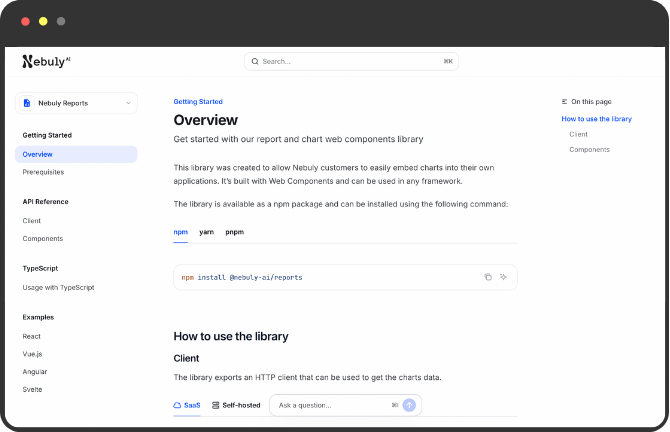
You can now embed Nebuly reports directly into your product’s UI using our new Components library.
This allows customers to seamlessly integrate Nebuly analytics and dashboards into their internal tools or end-user applications, providing insights where teams already work, without leaving their own environment.
💡 Example use cases:
- Embed usage reports inside your customer portal to show engagement metrics in real time.
- Integrate conversation analytics into internal dashboards for product and support teams.
- Add custom visualizations (e.g. retention or error rate charts) to your existing reporting pages.
Developers can get started quickly using the Nebuly Reports Components docs.
With this update, teams can deliver data visibility and insights natively within their products, reducing context switching and improving decision speed.
You can now choose to hide the content of user interactions when sending them to Nebuly via API.
By setting hide_content = true, the input and output text will appear as *** in the dashboard , keeping sensitive data private, while all analytics and aggregations (topics, sentiment, frustration, etc.) continue to be calculated normally.
This option can be enabled by your team when integrating Nebuly, giving you full control over what data is visible while maintaining complete insight into user behavior.

We’ve expanded the Contextual Chart Menu so it now works with more than just filters and "group by" options.
You can now use variables like:
- Error rate
- Explicit error rate
- User feedback
- User rating
Clicking any of these variables in the contextual menu will automatically apply a filter to the relevant page. This helps you drill into the data faster and cut out noise, making it easier to focus on the insights that matter. Click here to try it out.
A new Report Compare feature lets you view metrics from two projects side by side.
From the Reports section, select a second project to compare with the one you’re viewing. Once enabled, all charts in the report will show the comparison. This makes it simple to spot differences and similarities in metrics, trends, and interactions.
With this update, you can understand performance variations between projects without switching back and forth across reports. Click here to try it out.
.gif)
You can now search for variables directly in charts. No more scrolling through long lists, just type what you need and jump straight to it. Click here to try it out.
.gif)
Metric charts now display values in a compact format (e.g., 1.2K, 3.4M). This makes large numbers quicker to read and easier to interpret in high-volume datasets. Click here to try it out.
.gif)
Ever wondered if your users write prompts with just a few keywords or long detailed instructions? Now you can see it.
We’ve added a new Prompt Quality filter with three levels:
- Low quality: keyword-only prompts
- Medium quality: short questions
- High quality: detailed, structured prompts
You can also use this as a group by option in the reports section. It gives you a clear view of how interactions spread across these categories. Click here to try it out.
.gif)
You can now switch between Count and Percentage views in line charts and horizontal bar charts when analyzing interactions or users.
- Count mode (default): shows the total number of interactions or users.
- Percentage mode: shows the share of interactions or users relative to the total in each group.
Example: If you’re tracking daily interactions for topic “A”:
- Count mode shows the total daily interactions for topic A.
- Percentage mode shows what share of all interactions each day were about topic A.
Click here to try it out.
.png)
We’ve added a new Role-Based Access Control (RBAC) feature that lets admins decide which users can access each project.
From the three-dot actions menu in Project settings, you’ll now see a new option: “Manage access.”
In this menu, you can:
- View and edit the list of users with project access
- Add or remove users from a project (admin access cannot be changed)
- Make sure only the right team members can see and work on each project
By default, all new users are automatically given access to all projects. Admins should remove access where needed to maintain security and focus.
This update gives you more control and flexibility over project access, while keeping your workspace secure and organized. Click here to try it out.

You can now build clustered bar charts directly in the chart creation page. Click here to try it out.
.gif)
The contextual menu, once limited to Reports, is now available on all charts across the platform, including those in the Overview and Root Cause Explorer.
This update creates a consistent, quick-access experience. You can now click on any point in a chart to open the menu and take related actions, such as viewing topics, interactions, users, or business risks tied to that data point.
It’s now simpler to dig deeper into insights wherever you are in the platform. Click here to try it out.
.png)
We’ve improved backend performance to make pages faster and more efficient:
- Reduced TTR (time to render) for user intelligence
- Updated retention calculation method (same results, but now 30% less computing time).
You can now add contextual events directly to time series charts.
Admins can click on any data point within a report chart to add or remove events. These events will appear as visual markers (annotations) across all time series charts in reports, making it easier to correlate changes in metrics with key events.
While all users will be able to see events on charts, only admins have permission to manage them. Click here to try it out.
.png)
The detail pages for User Intelligence sections (Topics, User Intents, …) have a new layout:
.png)
All data from the previous version remains available:
- Stats previously shown in tab buttons now appear as small chips above the table
- Problems can be accessed through the dropdown at the top of the left sidebar
- The summary is available through the “Summarize” button on the right of the Filter picker
You can now define a custom start date and let the end date update dynamically based on the user’s current session. This is available in all time selectors and charts across the platform. Click here to try it out.
You can now update a saved Project View after creating it. Originally designed to store and reuse custom filters, these views are now fully editable. What's new:
- Edit mapped projects directly from the Projects page
- Improved UX for charts with double group-by
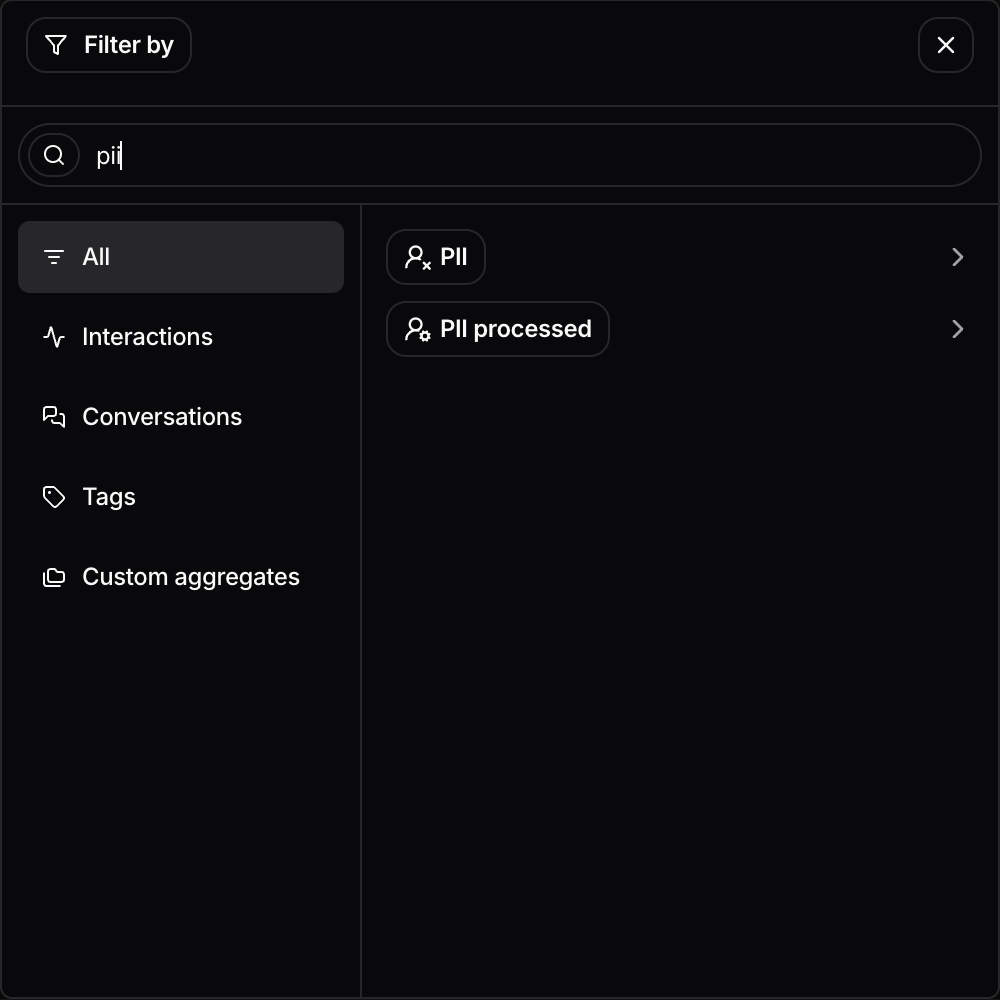
- Filter to hide interactions where PII hasn’t been processed (only shows if enabled on backend)
- Actions are now available in table charts (both single and double group-by). Click here to try it out.
A few weeks ago, we added support for tables with multiple breakdown values—a feature that was well received. But we also heard a common pain point: too many rows made the data hard to read in compact view.
We’ve now redesigned the UI to fix this. In compact view, only the first group by is shown. Each row can be expanded to reveal the second group by.
For example, if you group a table by “Topics” and “Geography,” you’ll first see the breakdown by Topic. Clicking a Topic row expands it to show the geographical distribution for the selected columns. Click here to try it out.
We’ve upgraded our Anonymization module to use LLM-based intelligence for detecting and removing personal information in conversations.
When enabled, interactions are temporarily shown as “obscured” until our LLM processes them.
To make this easier to manage, we’ve added a filter that hides all unprocessed (masked) interactions, so you can view only the sanitized data.
You can now add custom columns to the Interactions page when aggregating by conversation. These columns let you annotate conversations and use those annotations as. filters across the platform. Click here to try it out.
.gif)
We’ve replaced the old “Areas of Improvement” section with a new one focused on failure insights. The updated view offers broader visibility into the kinds of errors users encounter. You can now see error types organized in the left sidebar.
We know that LLMs can make mistakes - in fact, we highlight them!
Sometimes, our own model slips up too. That’s why we now let you flag and edit properties extracted by Nebuly’s LLM engine.
While reviewing any interaction, you can select a property and edit its value. This helps ensure the data reflects real outcomes, and helps us fine-tune the model for your use case.
You can now group your table charts by more than one field, making it easier to compare data across two dimensions, like topic by geography or model by user type.
This gives you more control over how you structure your tabular insights, without needing to create separate reports.
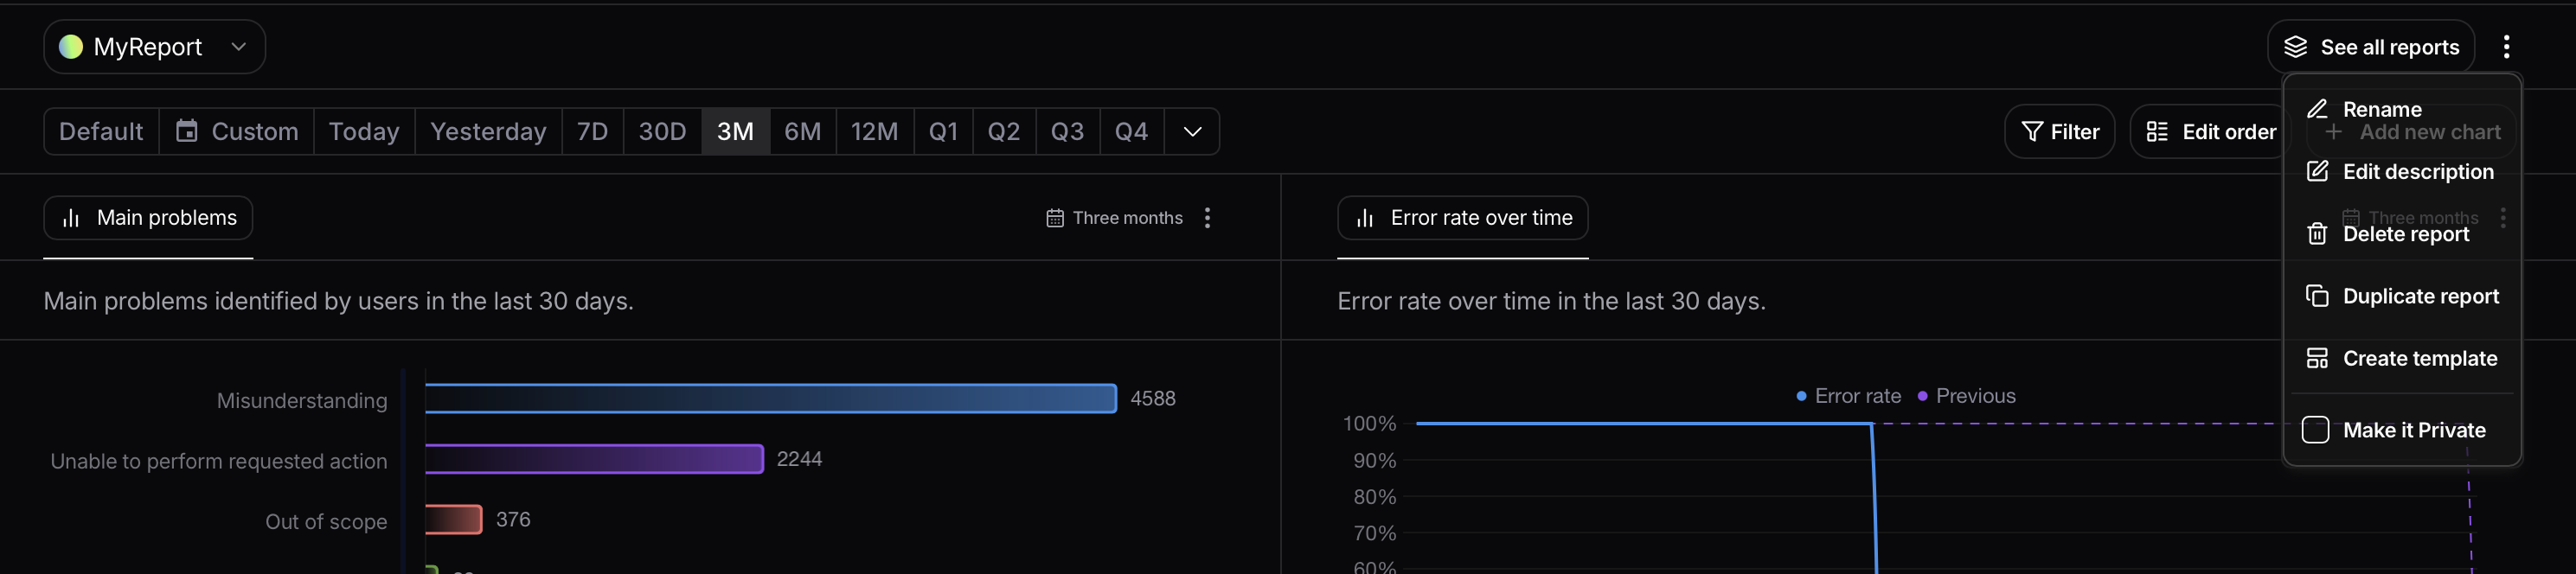
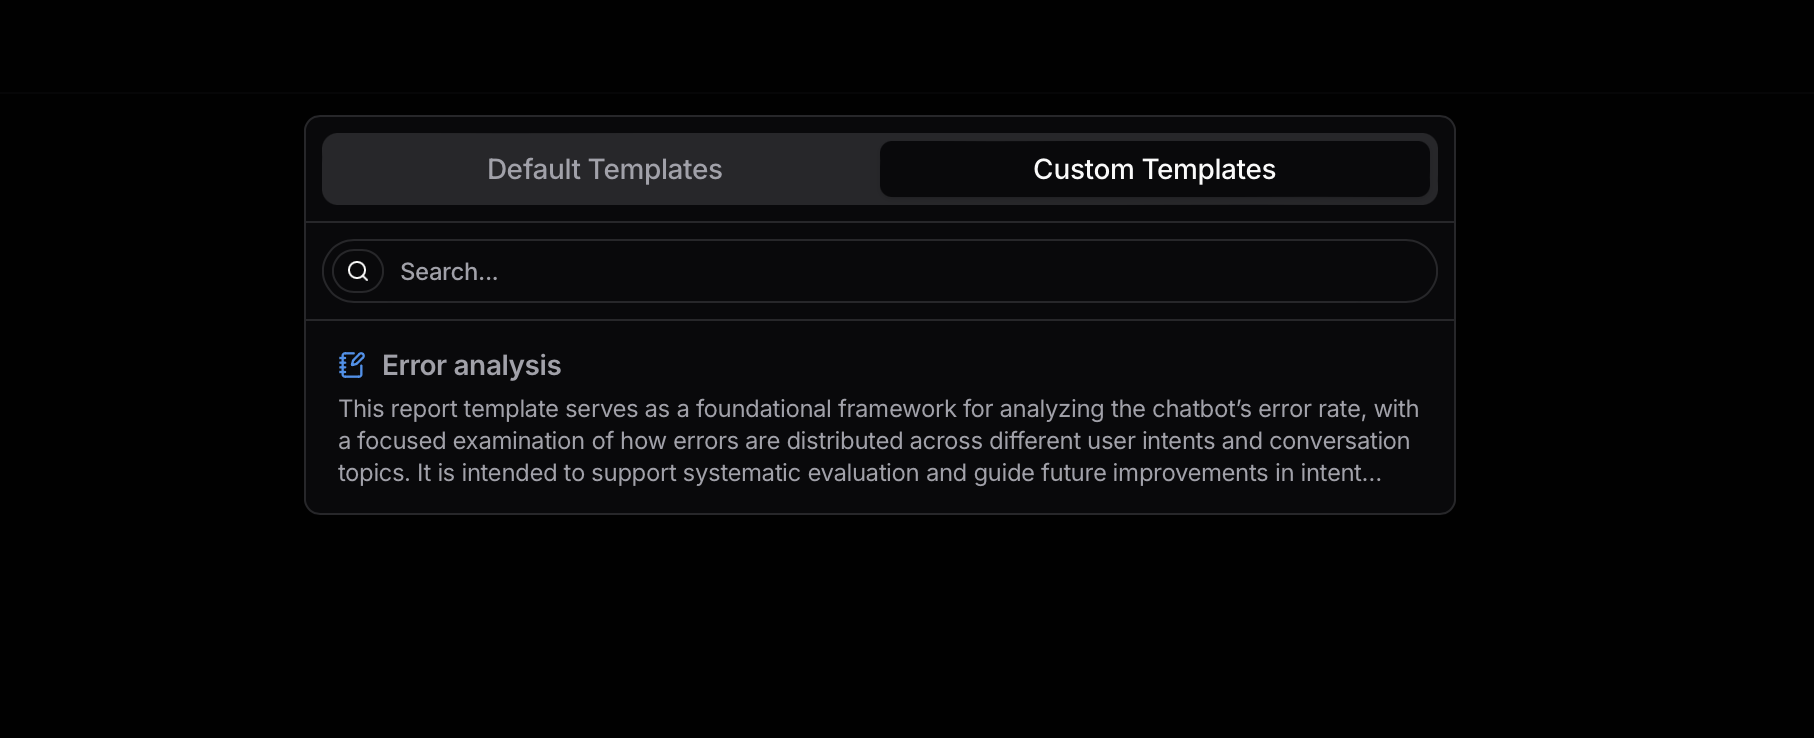
You can now turn any existing report into a template, making it faster to build new reports with the same structure, filters, or visuals.
Just click “Create template” on any report, and it’ll be saved under Custom templates, ready for you to reuse when starting a new report.
We’ve significantly improved the Export CSV functionality by increasing the maximum number of rows that can be exported.
Previously, CSV downloads were limited to 2,000 rows, which made it difficult to work with large datasets or conduct comprehensive offline analyses.
With this update, that limitation has been removed, you can now export CSV files with an unlimited number of rows.
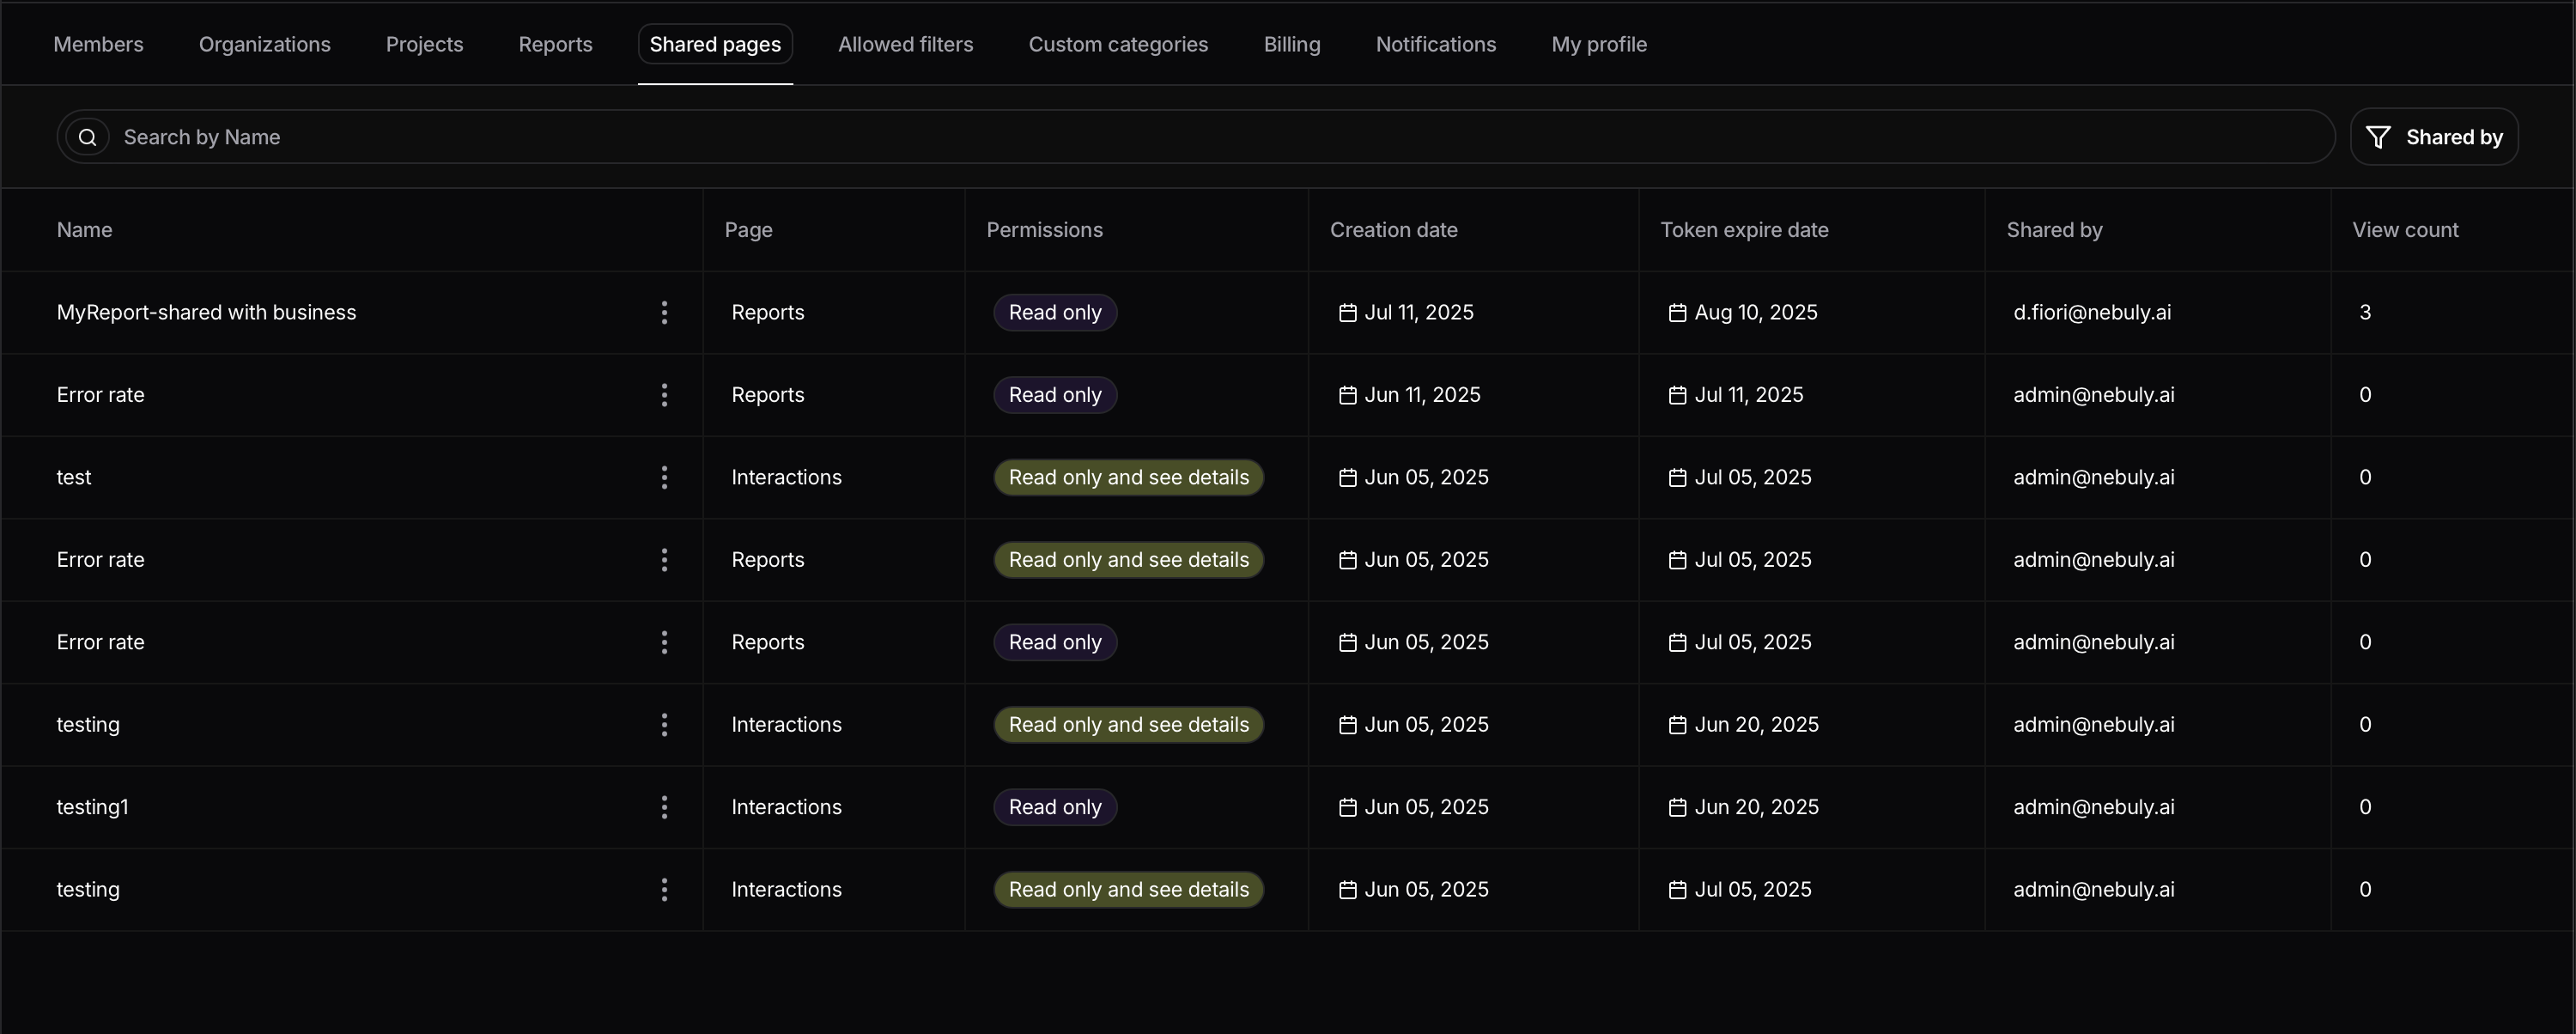
You can now track how many times your shared report links have been accessed, giving you better visibility into who’s engaging with your reports and how often.
Perfect for when you're sharing insights outside the Nebuly platform.
To better define what constitutes an LLM issue for our customers, we’ve introduced two new problem categories: Out of Scope and Poor Prompt Quality.
Out of Scope:Includes interactions where the LLM failed to provide an answer due to limitations set by the developers—such as constraints in the system prompt. You can decide whether to include these interactions in the Dissatisfaction Rate.
Poor Prompt Quality: Refers to cases where the LLM couldn’t respond because the user’s prompt lacked sufficient context or clarity. Like the “Out of Scope” category, these interactions can be optionally included in the Dissatisfaction Rate.
Enabling or disabling these categories will affect both the Dissatisfaction Rate and the LLM Problems Overview page. When deactivated, the relevant columns for “Out of Scope” and “Poor Prompt Quality” will appear in a different color for easier identification.
(And yes, we’ve also updated the chart showing the distribution of problem types. Looks better, doesn’t it?)
.png)
.png)
We’ve just launched one of the most requested features: report templates!
Now, when creating a new report, you no longer have to start from a blank table—you can choose from pre-filled templates.
We’re starting with two:
- A customer support chatbot template designed to help teams quickly analyze performance and usability for support use cases.
- A general-purpose template highlighting the main strengths and weaknesses of your copilot.
.png)
We’ve further improved our Export CSV feature, making it easier for customers who open files in Excel.
Special attention was given to enhancing both encoding and visualization, particularly when using Chinese ideograms!
You can now create custom topics directly from the Topics page. Just hit “Create new topic” to define your own categories based on specific actions or keywords. Add a name and short description to help our LLMs accurately tag user interactions, and give your analytics a bit more structure (and sense).

Noticed an action or problem that doesn’t quite fit its topic? You can now move it to where it truly belongs.
Select the items, click “Move to”, and choose the right topic. Done - your actions and problems are instantly reclassified, keeping everything organised and meaningful.
.gif)
We’ve improved the experience of exploring user discussions within a topic.
You’ll now see a chart that tracks daily active users engaging with the topic, along with an AI-generated summary that gives you a quick overview of what the conversation is about.

For a deeper dive into user intent and behavior, the new User Actions section breaks down granular actions, and now includes user quotes to surface what people are actually saying.

We’ve also introduced a dedicated Error Rate section to help you identify LLM issues more easily. It surfaces both high-level problem types and detailed, user-level problems.

We’ve enhanced the Risky Behavior section by adding user quote examples, making it easier to understand the kinds of issues or behaviors users are exhibiting.
We also introduced three global cards to give you a clearer snapshot of risky situations.

We’ve redesigned the filter picker to make it easier to use. Filter values are now grouped into categories, so you can navigate between them more easily and find what you need faster.

Bar chart lovers, this one’s for you!
We’ve extended several features, previously exclusive to time-series line charts, to time-series bar charts. You can now:
- Compare the current time range with the previous one (e.g., month-over-month, week-over-week, etc.)
- Apply the average function to visualize trends more clearly
- Forecast future values for any selected metric
More ways to explore your data, now in bar chart form.

A new addition for enterprise teams: we now support Single Sign-On (SSO) via LDAP. This allows users to access the Nebuly platform using their existing LDAP authentication provider (like Microsoft Entra).
To get started, assign user roles directly within the platform:
- Viewers: Read-only access
- Members: Can create reports, but not edit or delete those created by others
- Admins: Full permissions, including merging entities (e.g. topics) and marking problems as irrelevant
We’ve enhanced our Role-Based Access Control (RBAC) system. Previously, the distinction between Member and Admin roles was too subtle, making it hard for customers to confidently share access without risking unintended changes like merged topics or edits to other users’ reports.
To fix this, we’ve made permissions more explicit:
- Admins: Have full access, including the ability to merge topics and edit or delete any report.
- Members: Can only modify their own reports and charts. They cannot edit shared elements such as topics or LLM problems.
Following helpful feedback about the value of risk type classifications on the Risky Behavior page, we’ve now extended this functionality to all charts. You can filter or group data by risk type across your analysis, making it easier to drill into specific patterns and trends in risk.
We’ve released two updates to make your workflow smoother:
1. Automatic Project Recall:When you log in, you’ll now be taken directly to the last project you viewed. This means you can pick up your analysis right where you left off - no need to manually navigate back.
2. Favorite Reports:On the reports page, you can now mark one report as your favorite for each project. That report will load by default whenever you open the page, saving you time and clicks.
If you regularly use cohorts as filters, this update should help streamline things. You can now edit existing cohorts and remove specific users you no longer want to track. To do this, head to the Cohorts page, select the cohort you want to update, and open the user list. From there, click the “three vertical dots” next to a user and choose “Delete.”

We’ve introduced a new chart to help you better understand user behavior over time. The Time Series Distribution chart allows you to answer questions like: “At what time of day are users interacting with my chatbot?” or “Which day of the week sees the highest activity?”
You can now create this chart by selecting a time frame (month, week, or day) and a desired granularity (week, day, or hour) to visualize the average of selected metrics across the chosen period.

Over the past month, we’ve been working toward achieving ISO 42001 certification, the first international standard for AI management systems.
This certification is an important step that reflects Nebuly’s commitment to building responsible, high-quality AI systems and maintaining strong ethical and operational standards.
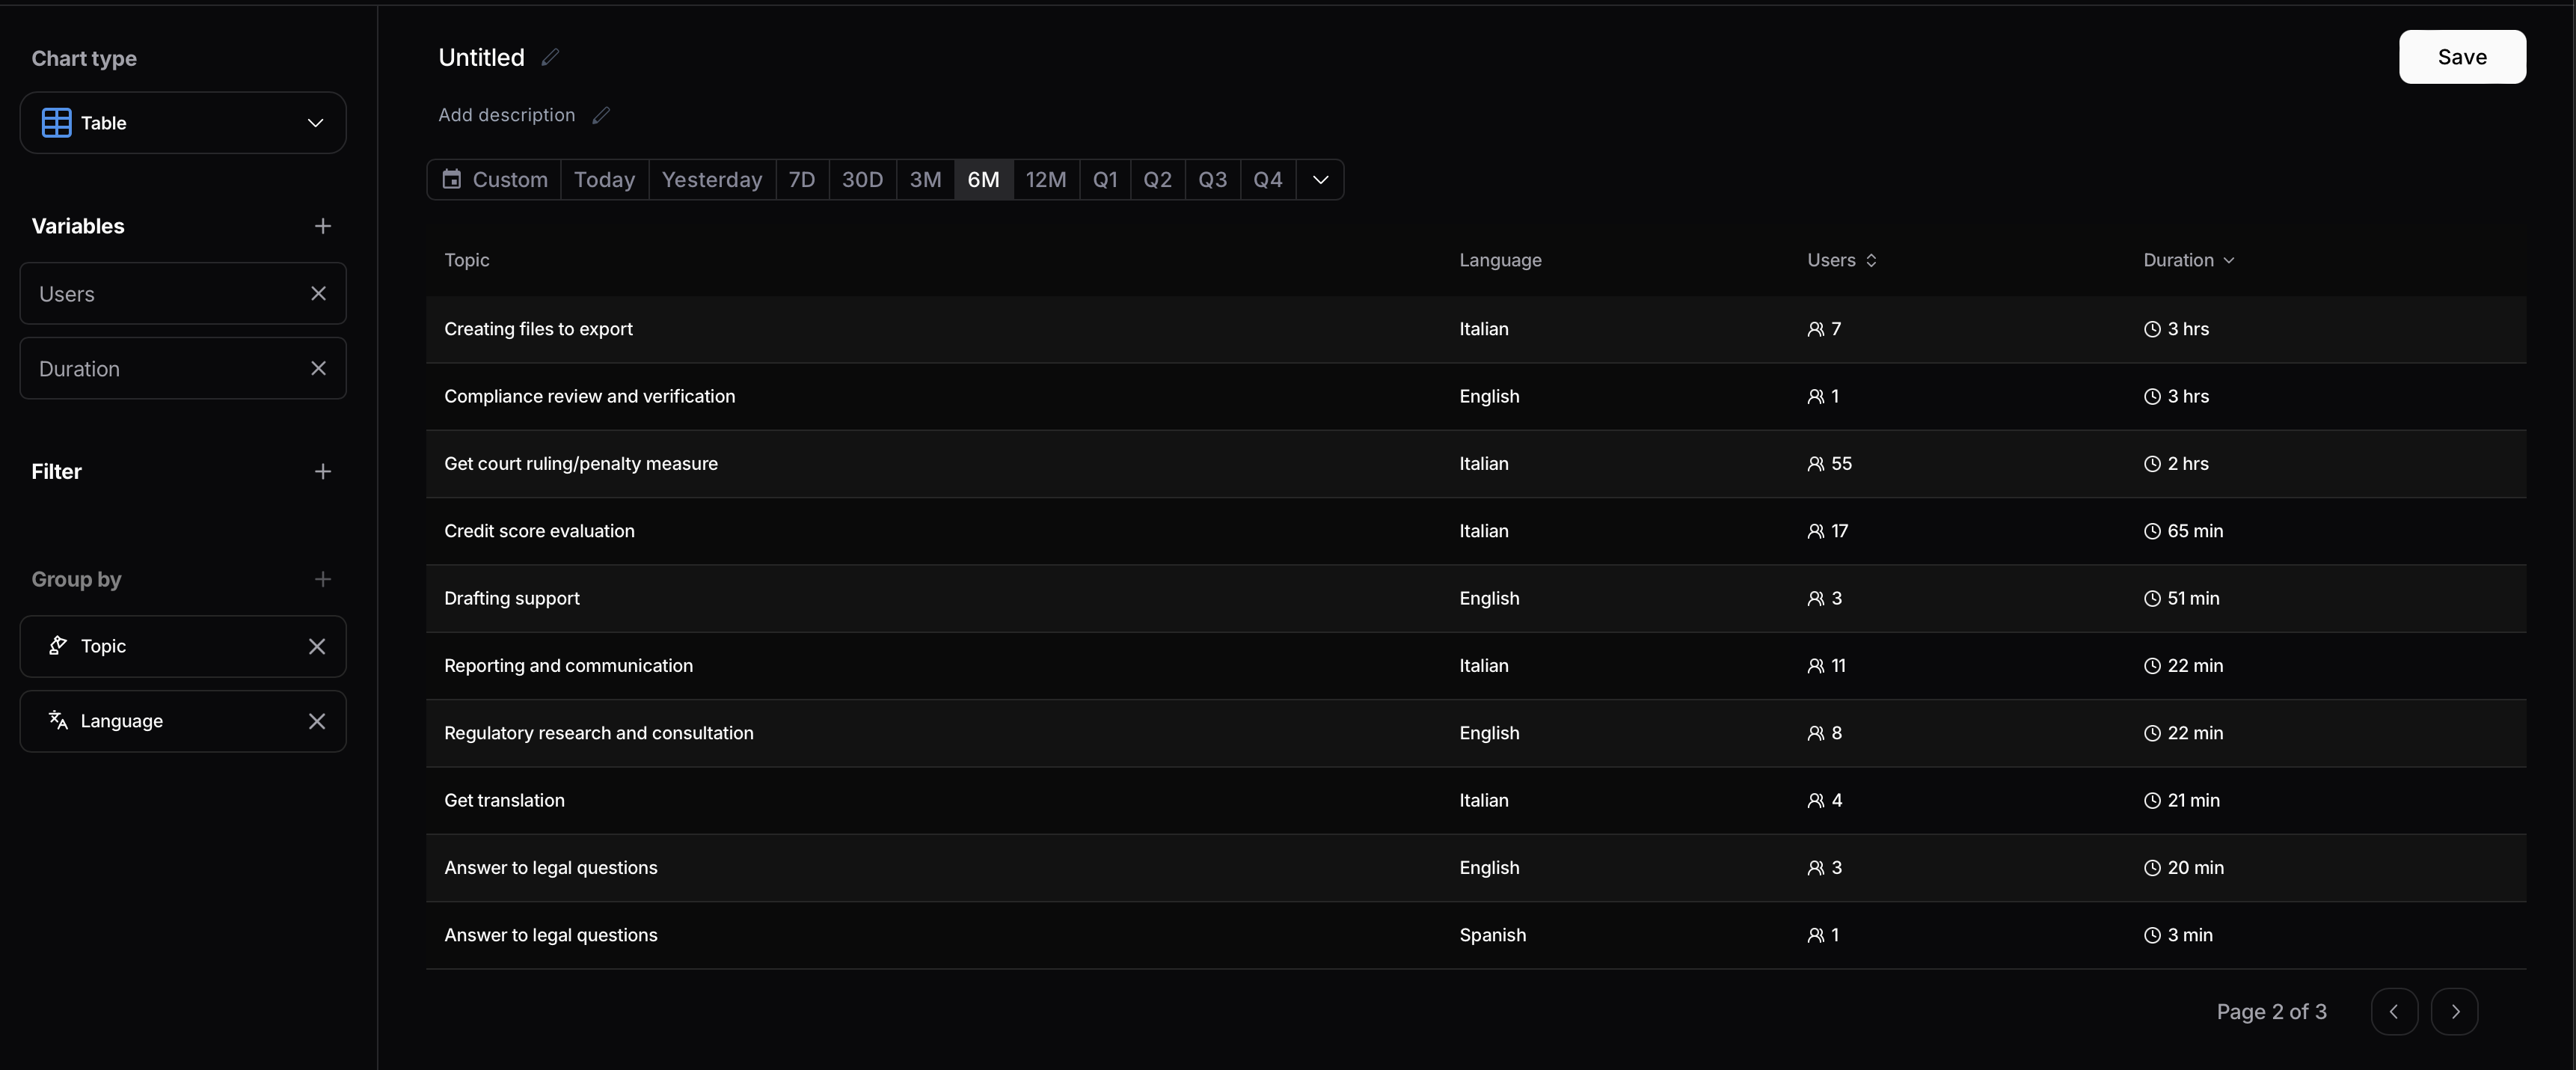
You can now create tables directly within reports to complement your visual charts. This allows you to alternate between graphical and tabular views, making it easier to analyze your data and understand how users are interacting with your product.

To further maximize customization on the platform, we’ve introduced the ability to fully select which metrics you want to display in the conversations table. This enhancement gives you greater control over your analytics view, allowing you to focus on the data that matters most to your use case.
.png)
We’ve significantly improved platform performance when handling large datasets. By migrating our database from Postgres to ClickHouse, we’ve achieved over a 100x reduction in latency when processing millions of interactions.
To further streamline the experience, the horizontal navbar on the “User Intelligence” page has been removed. You can now customize the sidebar to quickly access your preferred User Intelligence entities.
The overview page is now fully customizable. You can choose which metrics and charts to display by simply clicking on a metric and selecting your preferred one from the list.

All key analysis pages, including topics, intents, actions, risky behavior, and LLM issues, now feature a generated summary. These summaries highlight the main challenges users face when interacting with your chatbot, offering deeper context and insight to guide your analysis.

A new action details view has been added to provide more context around user interactions. You can now choose between viewing a generated summary of the user query in plain English or inspecting the raw interaction data directly.

If you prefer collecting explicit customer feedback using a 1 to 5 rating scale instead of thumbs up or down, we’ve added the perfect feature for you. You can now send user ratings directly to the platform and use them as filters across all areas of the platform.

We’ve introduced the “View Forecast” option for line charts in reports! This feature is perfect for predicting key variables like the number of users, user issues, or other trends over a given period. Simply enable the View Forecast option when creating a new line chart to start visualizing future trends effortlessly.
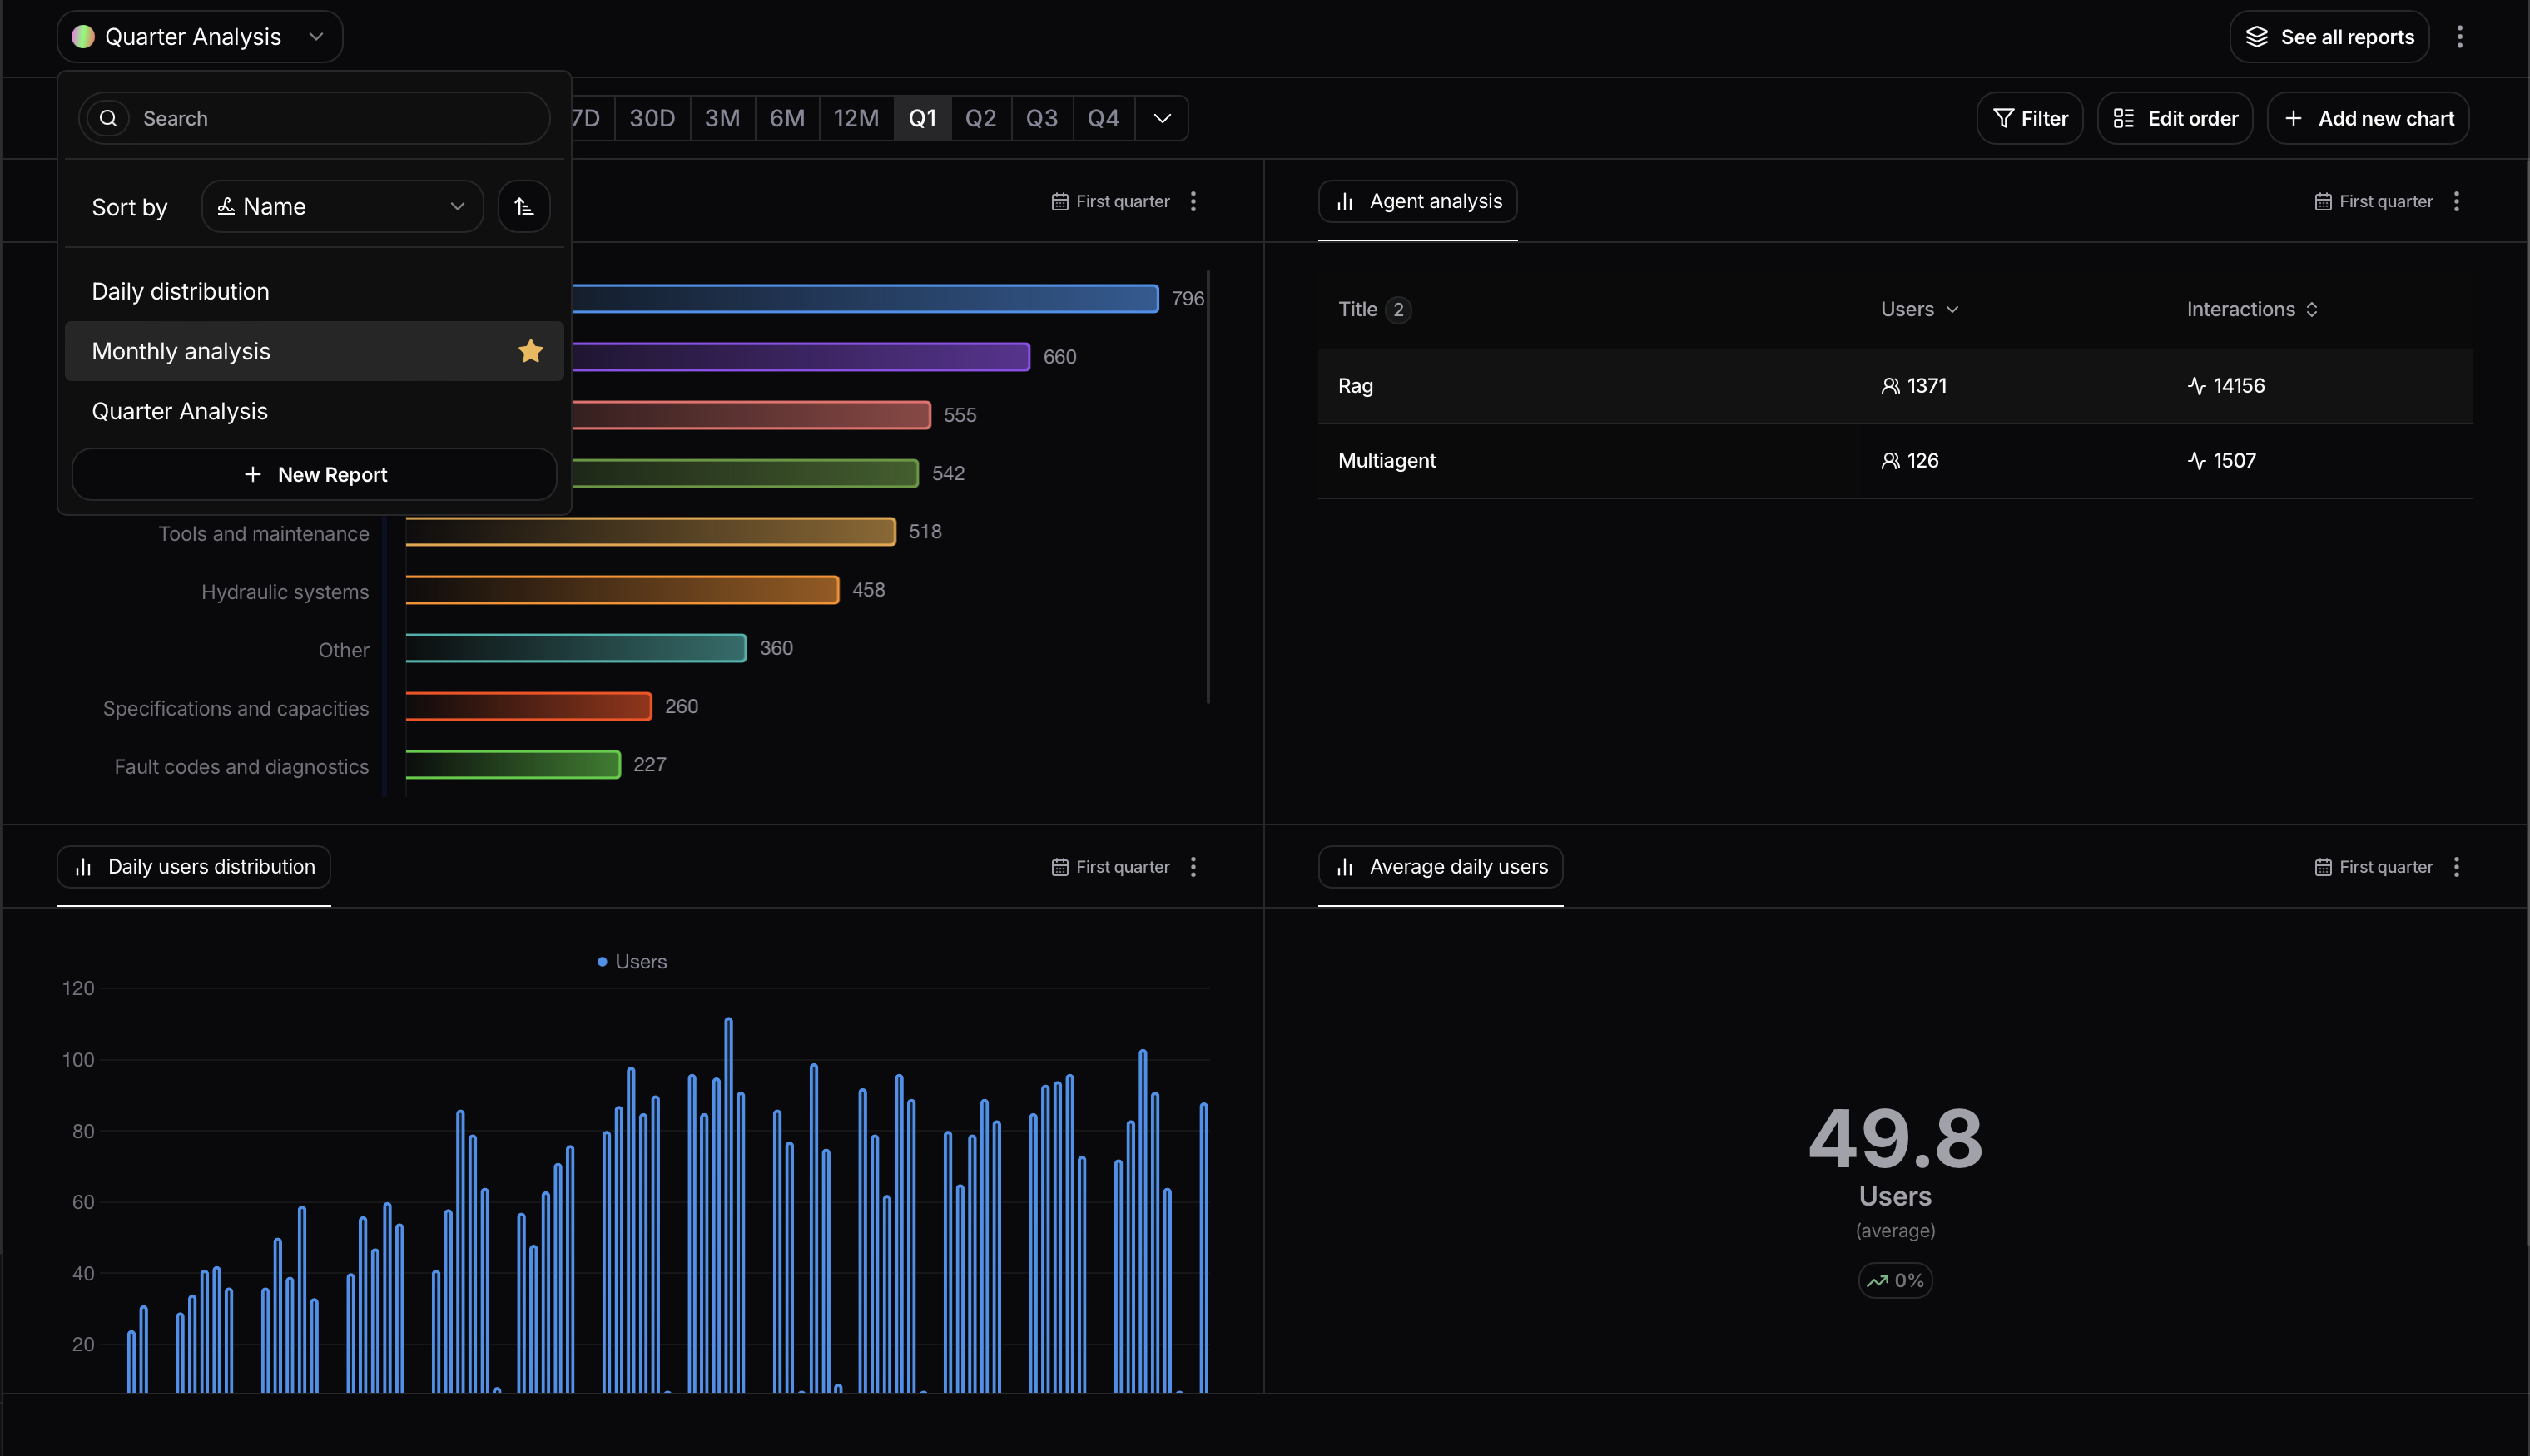
For customers managing dozens of reports, we’ve added search and sorting functionalities to streamline navigation. You can now:
- Search reports by name.
- Sort reports by name or creation date.
This enhancement ensures a smoother experience when working with multiple reports.
Our platform supports two types of user analysis:
- Conversation-Level Analysis (Aggregate Mode): This mode aggregates multiple interactions within a conversation, highlighting metrics such as overall topics, user intents, and recurring issues.
- Interaction-Level Analysis (Detailed Mode): Dive deeper into individual interactions within a conversation. This mode provides granular insights, capturing user intents, topics, and issues at each step.
Now, you can switch seamlessly between these modes by clicking the three dots in the top-right corner of the platform and selecting your preferred grouping: Interaction or Conversation.
We’re proud to announce that we’ve achieved SOC 2 Type 2 and ISO 27001 certifications in December! These certifications demonstrate our commitment to handling your data with the highest security standards in the industry.
As many of our customers deploy multiple GenAI products, we’ve introduced a new organizational structure to simplify managing user analytics across different projects.
Organizations
This is the top-level structure for managing your projects. An organization can represent:
- Your company name
- The environment of your chatbot (e.g., production vs. development)
- A specific team (e.g., Marketing, Product, Customer Success) looking to gain insight
Projects
Projects exist within each organization and let you dive deeper into analytics for specific chatbots or user groups. For example:
- Each project can correspond to one chatbot you’re measuring.
- Or, projects can focus on segments of your chatbot’s users, such as those in different geographical markets.
Understanding user retention is critical for growing and optimizing your GenAI products. That’s why we’ve enhanced our user retention chart with two new retention metrics to give you deeper insights into user behavior:
- Rolling Retention: Tracks users who returned consistently across all prior time periods. For example: Week 3 rolling retention includes only users active in weeks 1, 2, and 3. This is great for understanding long-term engagement trends.
- Anchor Retention: Measures user retention relative to a fixed starting point. For example: Week 3 anchor retention shows the percentage of users from week 0 still active in week 3. This metric is perfect for evaluating the overall stickiness of your product.
How to Use It
1. Navigate to the User Retention tab.
2. Select the retention type, either Anchor or Rolling.
3. Analyze the user trends and understand why users are returning.
4. Select a specific group of users, such as those returning every week, by clicking on either the point on the chart or the table below.
5. Create a cohort with only these users to gain deeper insights into their behavior.
6. Filter all user analytics on the platform for this subgroup by using the Filter button and selecting the cohort you created.
We’ve made it easier than ever to analyze interactions in your chatbot, regardless of the language your users speak. With our new one-click translation feature, you can translate all user-chatbot interactions into English. This is especially helpful for teams working in a different language than their users, ensuring you gain clear insights without language barriers.
How to Use It
1. Navigate to the Interactions tab.
2. Click the Translate button located in the top-right corner.
3. All interactions will instantly be translated into English for seamless analysis.
This feature empowers you to better understand and analyze conversations with your chatbot, no matter the original language of your users.
• Macro category of user problems with LLMs.We’ve added macro categories that identify areas where users encounter challenges due to limitations or errors in the language model. This feature provides a clear breakdown of common problem areas, such as knowledge gaps or functional limitations, helping you pinpoint specific pain points according to your end-users and enhance the overall user experience.

These macro-categories aren’t predefined; they’re automatically tailored to your specific use case, providing insights customized to address your users’ unique challenges. Some common issues we often observe include:
• Lack of Knowledge.
Users complain because the chatbot lacks information on specific queries.
• Inability to Perform Tasks.
Users request actions that the chatbot isn’t capable of performing.
• Incorrect Answers.
Users report dissatisfaction with inaccurate responses.
For each macro-category, you can click to explore related issues in greater detail. In the example below, the macro-category “Real-time information and internet access limitations” refers to situations where the chatbot cannot provide real-time or internet-sourced information. Within this category, you can see four clusters of specific issues, offering a highly detailed view of problems to address for a better user experience.

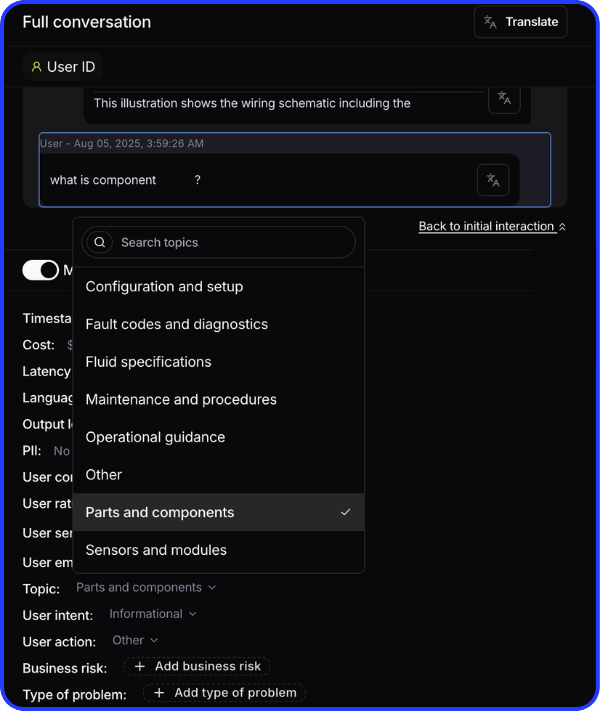
Understand the WHY behind each conversation.
By categorizing interactions as informational, transactional, support-related, or feedback-oriented, you gain insight into why users are engaging, enabling you to tailor responses and optimize content. By default we have added the following categories of user intent:
1. Informational.Users seeking information or answers to specific questions.
2. Navigational.Users looking to navigate to specific content or sections.
3. Transactional / Buying.Users showing buying signals or interest in making a purchase.
4. Support.Users seeking assistance or troubleshooting help.
5. Exploratory / Research.Users gathering information for broader knowledge.
6. Engagement / Feedback.Users interacting to provide feedback or engage with the content.
7. Complaint / Dissatisfaction.Users expressing dissatisfaction or negative sentiment.

This feature is incredibly powerful for quickly understanding why users are coming to the chatbot. For instance, if you’re curious about users with a purchase intent, you can simply click on the “Transactional” user intent. This will show you the topics these users are interested in buying. In the example below, users with a transactional intent are exploring the topic of literature, specifically seeking book recommendations.

We’ve renamed “User Intents” to “User Actions” to better reflect the tasks or objectives users are aiming to accomplish when interacting with the chatbot. By tracking actions like translating text, checking grammar, or writing emails, you gain a clear understanding of what users are actively doing. This allows you to identify user objectives more effectively and refine the chatbot’s functionality to meet their specific needs.

To help you gain deeper insights, we’ve added a new visualization option in the User Intelligence tab: Map View.
You can now visualize data in three different ways:
• Map (NEW).
This view is ideal for analyzing correlations between user metrics. For example, explore how user sentiment relates to retention or how thumbs-down responses correlate with engagement. Simply select two metrics (primary and secondary) to compare.

• Chart.
Track changes in key user metrics (e.g., topics, intents) over time to see trends and identify popular topics.

• Table.
Understand how user metrics connect to KPIs like retention and engagement. For example, see which topics yield the highest retention.

Many of our customers are interested in exporting the insights we generate to other platforms.
Now, you can effortlessly export any tabular data you see on the platform by downloading the related CSV file. Simply click the Export CSV button located at the top-right corner of each table.

We have made several enhancements to the reports section to improve the overall user experience.
• View details of LLM Issues.
Now, if you want to see details about a specific point on a chart, you can simply click and select the information you’re most interested in. We’ve also added the ability to view the LLM issues related to each specific point on the chart, helping you understand why users may be dissatisfied with the LLM’s responses.

• Compare with Previous Time Period and Average.
You can now add a comparison to the previous time period for each trend chart in the reports section. Additionally, you can compute and display the average over a specific time period. To activate these options, simply click the “Show Previous Period and Average” button when creating a new chart.

• Adjust Horizontal Bar Chart Text Space.
You now have the ability to adjust the size of the text area in horizontal bar charts to better accommodate long labels (such as user intents or behavioral alerts). Just click and drag the vertical blue line to resize the text space as needed

Some of you may want a deeper understanding of how a specific user is interacting with your LLMs. We’ve added a search option in the Users section, allowing you to quickly find the user you’re looking for. Additionally, we will soon introduce a dedicated Profile Page, which will display all insights related to a specific user’s behavior.

A conversation between your users and LLMs consists of multiple interactions.
Previously, our platform focused on analyzing user interactions with LLMs on an interaction-level, meaning that we computed metrics such as topics, user intents, and user issues for each individual interaction. Now, we’ve expanded our capabilities to also provide insights at the conversation level, where multiple interactions are summarized to give a more holistic view of the entire user conversation.
• Conversation-Level Analysis (Aggregate Mode).
In this mode, we provide insights at the conversation level, offering a holistic view of entire user interactions with LLMs. By aggregating multiple interactions within a conversation, this mode highlights key metrics like overall topics, user intents, and recurring problems.
• Interaction-Level Analysis (Detailed Mode).
This mode focuses on the individual interactions within each conversation, enabling a more granular analysis. By breaking down each interaction separately, it captures specific user intents, topics, and problems at each step of the conversation.
You can choose between the two modalities using the button in the top right corner of the platform:

We’ve also added a “Conversations” page, where you can view individual conversations, similar to how you could previously view interactions on the interactions page.

We’re excited to introduce a new overview page for LLM performance issues, along with a global metric to help you assess how your LLM is performing based on user interactions: the LLM User Error Rate. This metric provides a clear and actionable representation of your LLM’s performance from the users’ perspective. Additionally, we’ve added benchmarks to compare your performance against market data, providing better context for evaluation.
Here’s how the LLM User Error Rate is categorized:
• “Optimal” - Error rate < 10%
The LLM is performing exceptionally well, with minimal user frustration.
• “Moderate” - Error rate between 10% and 20%
The LLM’s performance is generally acceptable, though some users are encountering issues. In this case, we highly recommend reviewing the “Problems Identified” section and addressing those issues to improve the user experience and bring the metric closer to “Optimal.”
• “Critical” - Error rate > 20%
The LLM’s performance is suboptimal, with a significant number of users experiencing frustration. It’s highly recommended to immediately investigate the “Problems Identified” section and prioritize solving these issues to enhance the user experience and reduce the error rate.
This new metric will help you better understand and improve your LLM’s performance, ensuring you can take actionable steps toward achieving optimal user satisfaction.

New & Improved:
• Improved the UX in chart duplication: Now when duplicating a chart you can directly select the report you want to duplicate the chart in.

Fixes:
• Fixed a bug that prevented scrolling directly to the new chart when duplicating a chart in the same report.
• Fixed a bug in user filters that prevented the filters from being applied correctly.
• Improved the general stability of the reports page.
• Interactive Chart Reports
You can now click directly on points of interest (e.g., spikes) within your report charts to view the associated interactions, user intents, or topics. This feature allows for a more detailed and intuitive exploration of data trends.

• Enhanced Navigation for Horizontal Charts
For horizontal charts with breakdowns, you can now seamlessly navigate to the detailed user-intelligence page, just as you would when interacting with the user-intelligence tables, providing a consistent and efficient user experience.

We’ve improved the clarity of the interaction details page by clearly distinguishing between user interactions and assistant responses, making it easier to follow conversations.

• Translation UI Improvements
We’ve added a new feature to the translation UI that allows you to switch back to the original text after a message (or conversation) has been translated, offering greater flexibility in viewing content.

Now, when you hover over a chart (whether a line chart or horizontal bar chart) with a breakdown applied, the selected breakdown value is highlighted relative to the other lines or bars, enhancing the visibility and clarity of the chart data.

We added support for both the latest models released by OpenAI:
• o1-preview
• o1-mini
New & Improved:
• On the reports page, when a new chart is created, the page now automatically scrolls to the bottom where the chart has been added, ensuring you can easily view it right away.
• We have removed the global filters from the reports, as they were causing confusion with the dedicated report filters, streamlining the filtering process for better clarity.
Fixes:
• Fixed a bug preventing the sharing of user-intelligence pages.
On the user intelligence page, you can now customise the tabs to suit your preferences.
You can activate or deactivate the data types you’re interested in and arrange them in your desired order. Simply click the edit button on the right side of the tabs component and drag and drop the tab names to reorder them.

We have also added the ability to sort charts in reports.
Simply click the “Edit order” button in the top right corner of the report page. You can then rearrange the charts by dragging and dropping their names to your desired positions. This feature gives you greater control over how your data is displayed and shared with different stakeholders.

For applications where users interact in languages other than English, we added the option to translate the entire conversation instead of just a single message. This full-conversation translation feature greatly enhances the user experience by providing a broader view of what the user discussed across multiple messages.

We have improved the clarity of the retention charts. The configurable parameters and retention descriptions now explain the chart functionality more effectively. It is also easier to understand which parameters need to be modified to obtain the desired retention chart.

New & Improved:
• Now the granularity in the overview page charts automatically switches to hour when a single day time-range is selected on the platform.
• Default granularity values have been improved across the platform.
Fixes:
• Fixed several UI bugs across the platform, resulting in a cleaner user interface and improved user experience.
• Fixed a bug on the report page that directed users to the wrong page when clicking on the breadcrumb.
• Fixed a bug in the average sentiment score rounding.
In order to give a better visibility on the trends of quantities like topics, behavioural alerts and user intents, we updated the user intelligence page. Now it is possible to choose between two different visualizations:
• Table
Where you will keep visualizing the information you are used to in a tabular way.

• Chart
Where you can select the topics, intents or behavioural alerts you are most interested in and visualize them as a time-series in the selected time range. This will help you in analysing the trends in the time-frames you are most interested in.

For each user metric (such as a specific topic), you can choose to visualize the trend of various related “primary metrics.” For example, you might explore:
• The trend of interactions related to the topic
• The LLM error rate associated with the topic, and more
To visualize these trends, simply select the primary metric of interest using the button below:

To adjust the granularity of the x-axis, you can select from “Hour,” “Day,” “Week,” “Month,” or “Year.”

To provide a comprehensive analysis of how your users are interacting with the chatbot, we have added two more metrics you can monitor to the user intelligence page:
• User emotions
We selected a set of 27 emotions based on psychological literature.
For each interaction, we detect whether the user is expressing one or more of these emotions.
• User sentiment
Each interaction is classified into one of six sentiment categories:
• Very Negative. When the user uses highly explicit negative terms or expresses a strongly opinionated negative view.
• Negative. When the user is irritated, complaining, or mildly insulting the assistant.
• Neutral. No discernible sentiment is detected.
• Mixed. Both positive and negative sentiments are expressed in the interaction.
• Positive. When the user praises something, either implicitly or explicitly.
• Very Positive. When the user is enthusiastic about something.
Both metrics are computed at the interaction level and can be visualized on the User Intelligence page as well as in reports.
For applications where users interact in languages other than English (such as Spanish, German, etc.), you can now easily translate raw interactions into English using the “Translate to English” feature.
This functionality simplifies platform use in multilingual environments, eliminating the need to manually translate what your users are saying.
To activate translation, simply click the “Translation” button within the details of the raw interaction.

To simplify using the User Retention page, you can now easily select the “Retention Frequency” from:
• “Daily”: users coming back every day
• “Weekly”: users coming back every week
• “Monthly”: users coming back every month
As well as the “Starting Date”, which is the date you want to begin analyzing retention.


copy link button to copy the link to your clipboard.


