What executives need to see: Building an AI agents value dashboard from user analytics

According to Google Cloud's recent study, 52% of executives have already deployed AI agents for measurable business value, moving beyond pilots into production environments that directly impact revenue, cost reduction, and operational efficiency. Yet a critical gap remains: while companies invest heavily in sophisticated AI agents across finance, retail, manufacturing, and healthcare, most lack the visibility to understand whether these investments deliver the promised returns. The challenge isn't technological: it is measurement. Traditional business intelligence dashboards capture point-and-click behaviors, but AI agents operate through conversational interfaces where success looks different.
When a financial services AI agent processes loan applications, a retail assistant handles customer inquiries, or a manufacturing copilot optimizes supply chain decisions, executives need new metrics that connect user engagement to business outcomes. This is where user analytics becomes the foundation for building executive dashboards that demonstrate tangible AI value.
From pilots to production: why traditional metrics fall short
Enterprise AI agents represent a fundamental shift from reactive tools to proactive decision-making partners. In finance, agents now autonomously analyze market data and flag risk patterns. In retail, they predict customer preferences and adjust inventory in real time. Manufacturing agents coordinate complex supply chains while healthcare assistants streamline patient care workflows. But measuring their impact requires moving beyond traditional software metrics.
Click-through rates and page views tell us nothing about whether an AI agent successfully resolved a customer's banking question, helped a doctor make a more accurate diagnosis, or enabled a supply chain manager to prevent costly delays. The most successful AI implementations share a common trait: they instrument user interactions to understand both engagement patterns and business impact. This means capturing not just how often agents are used, but how they're used, what outcomes they produce, and where they create the most value.
Building executive dashboards that matter: the four pillars
Pillar 1: adoption and engagement intelligence
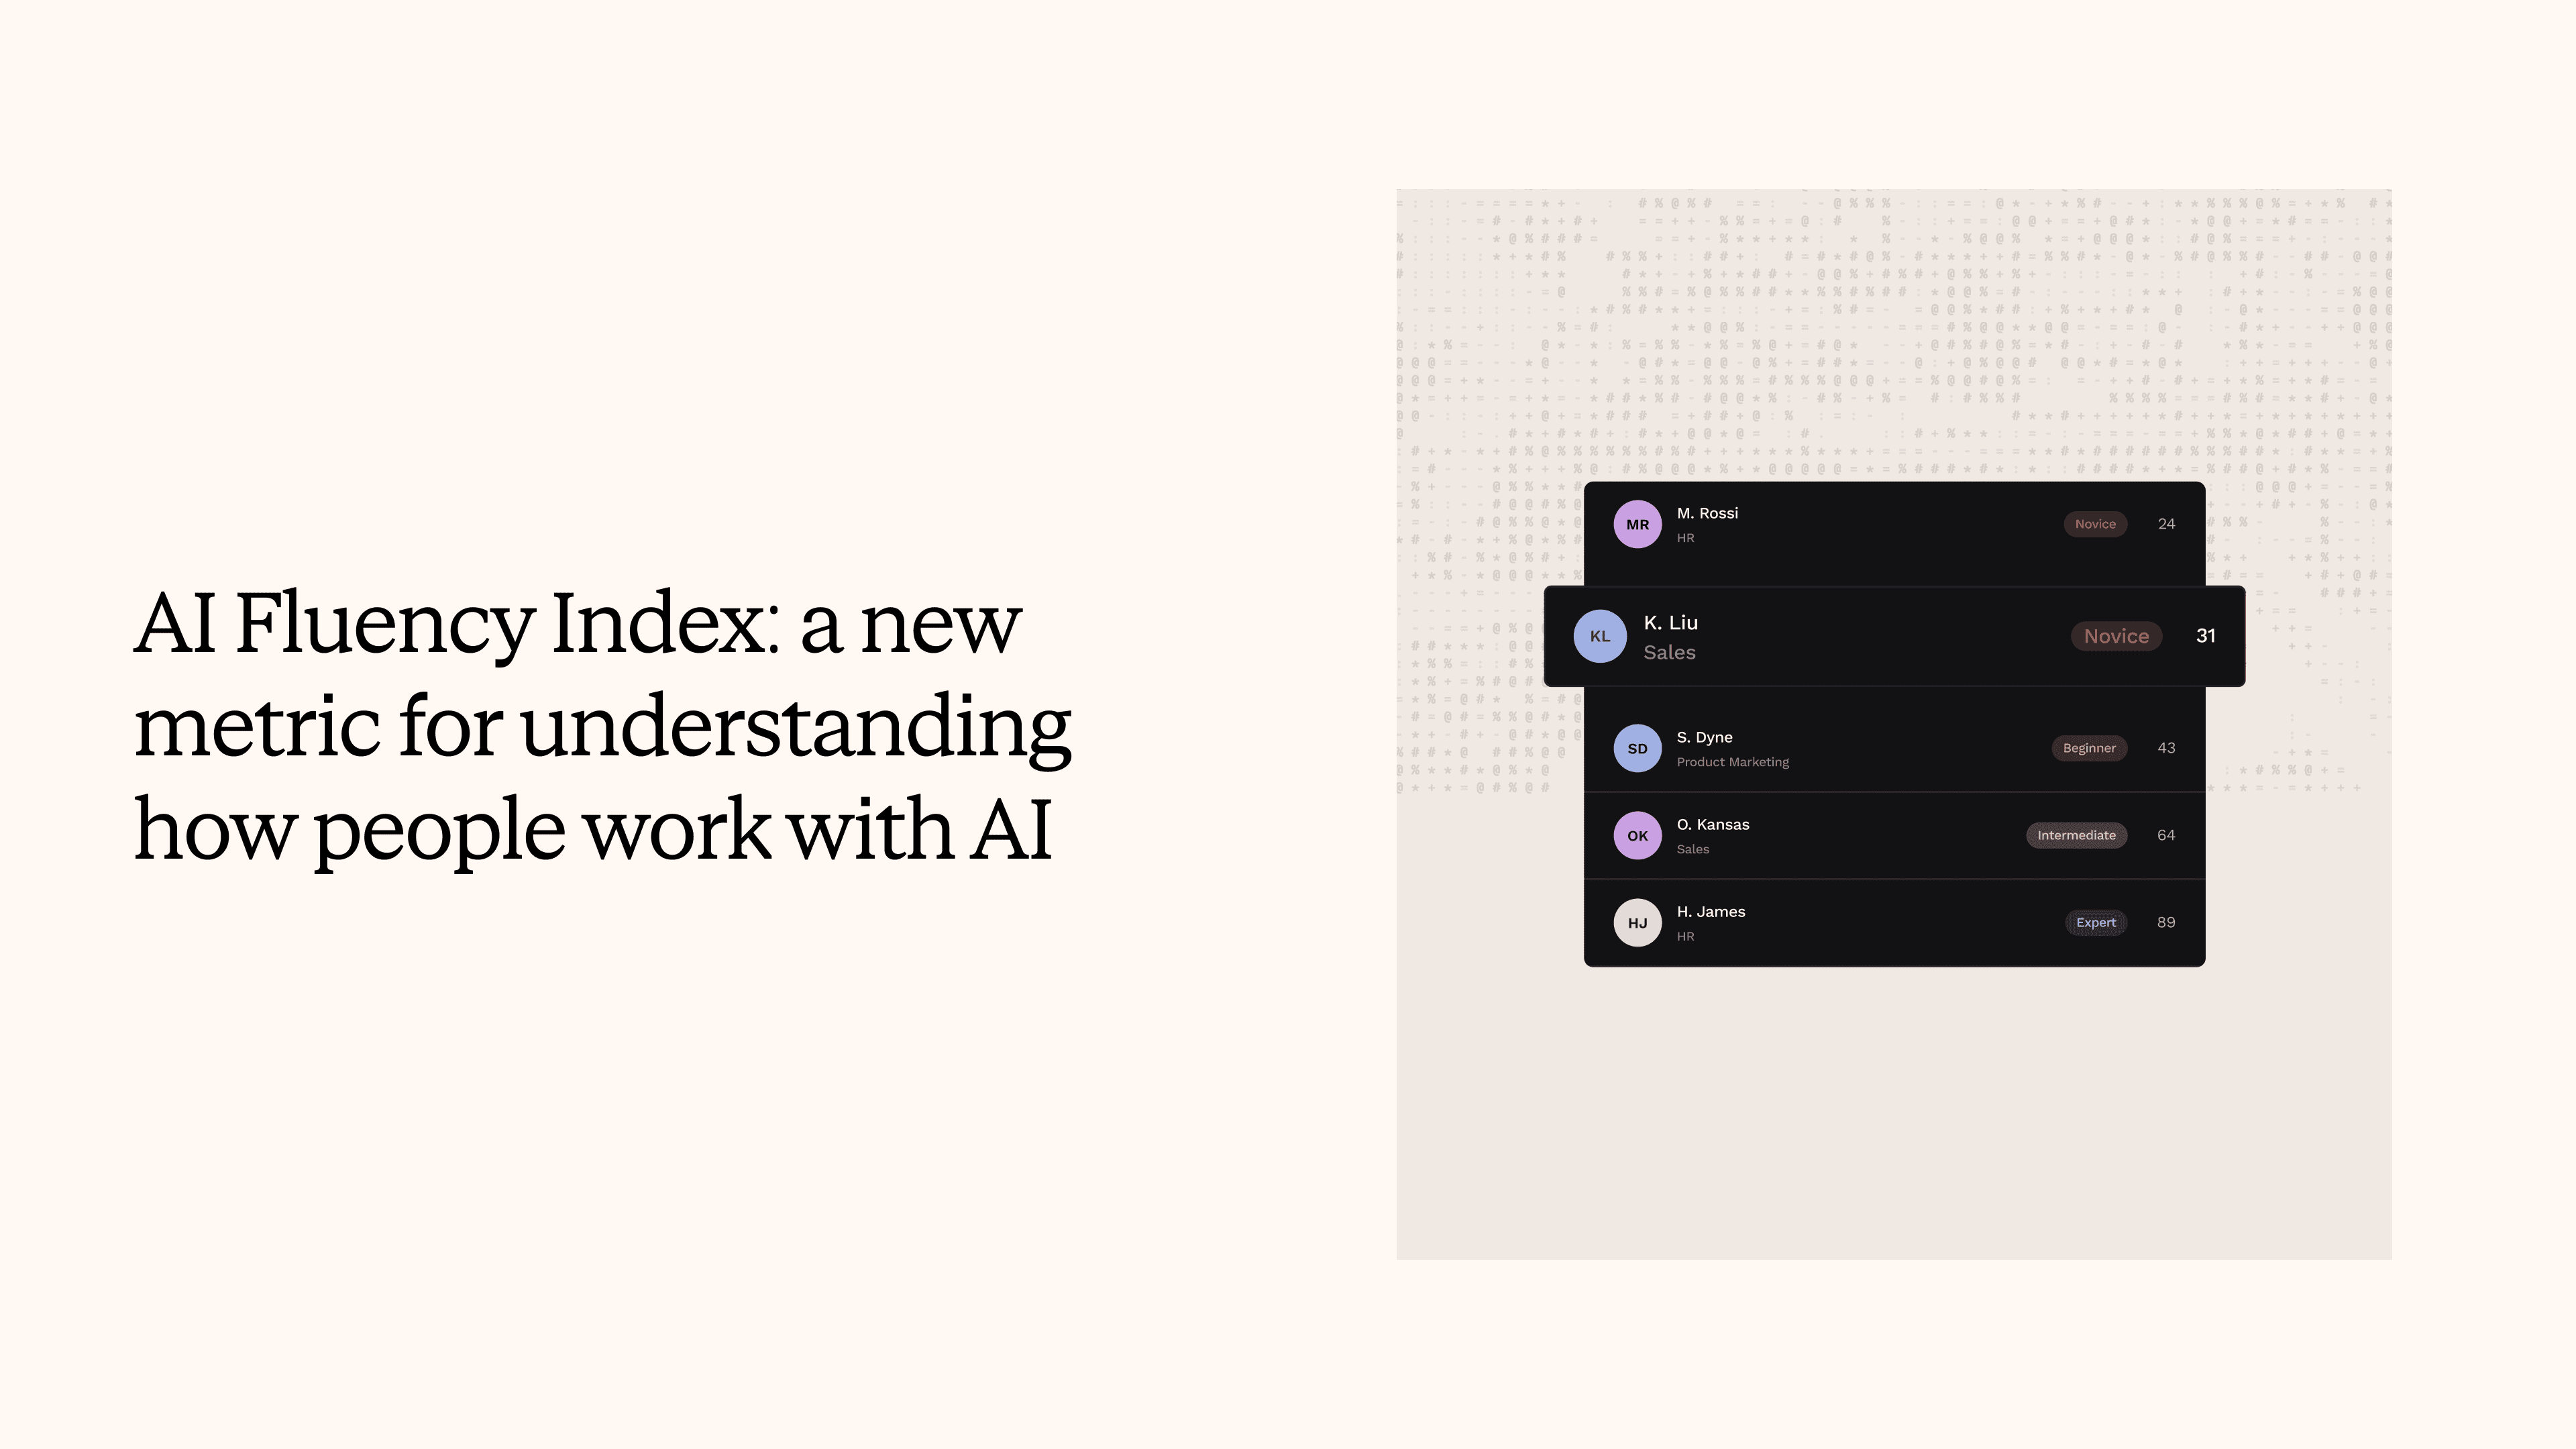
Effective AI value dashboards start with understanding who uses AI agents, how frequently, and for what purposes. This goes beyond simple user counts to examine engagement depth, session patterns, and feature utilization across different business functions.
In financial services, executives need to see whether traders actually rely on AI-generated market insights during critical decision moments, not just access rates. For retail leaders, the metric is not how many customers interact with shopping assistants, but whether those interactions lead to purchases, reduced return rates, or higher customer satisfaction scores. User analytics platforms can segment adoption by role, department, and use case complexity, revealing which AI implementations drive genuine business value versus those that remain novelties. This intelligence helps executives allocate resources to high-impact areas while identifying underutilized investments that need attention.
Pillar 2: risk and compliance monitoring
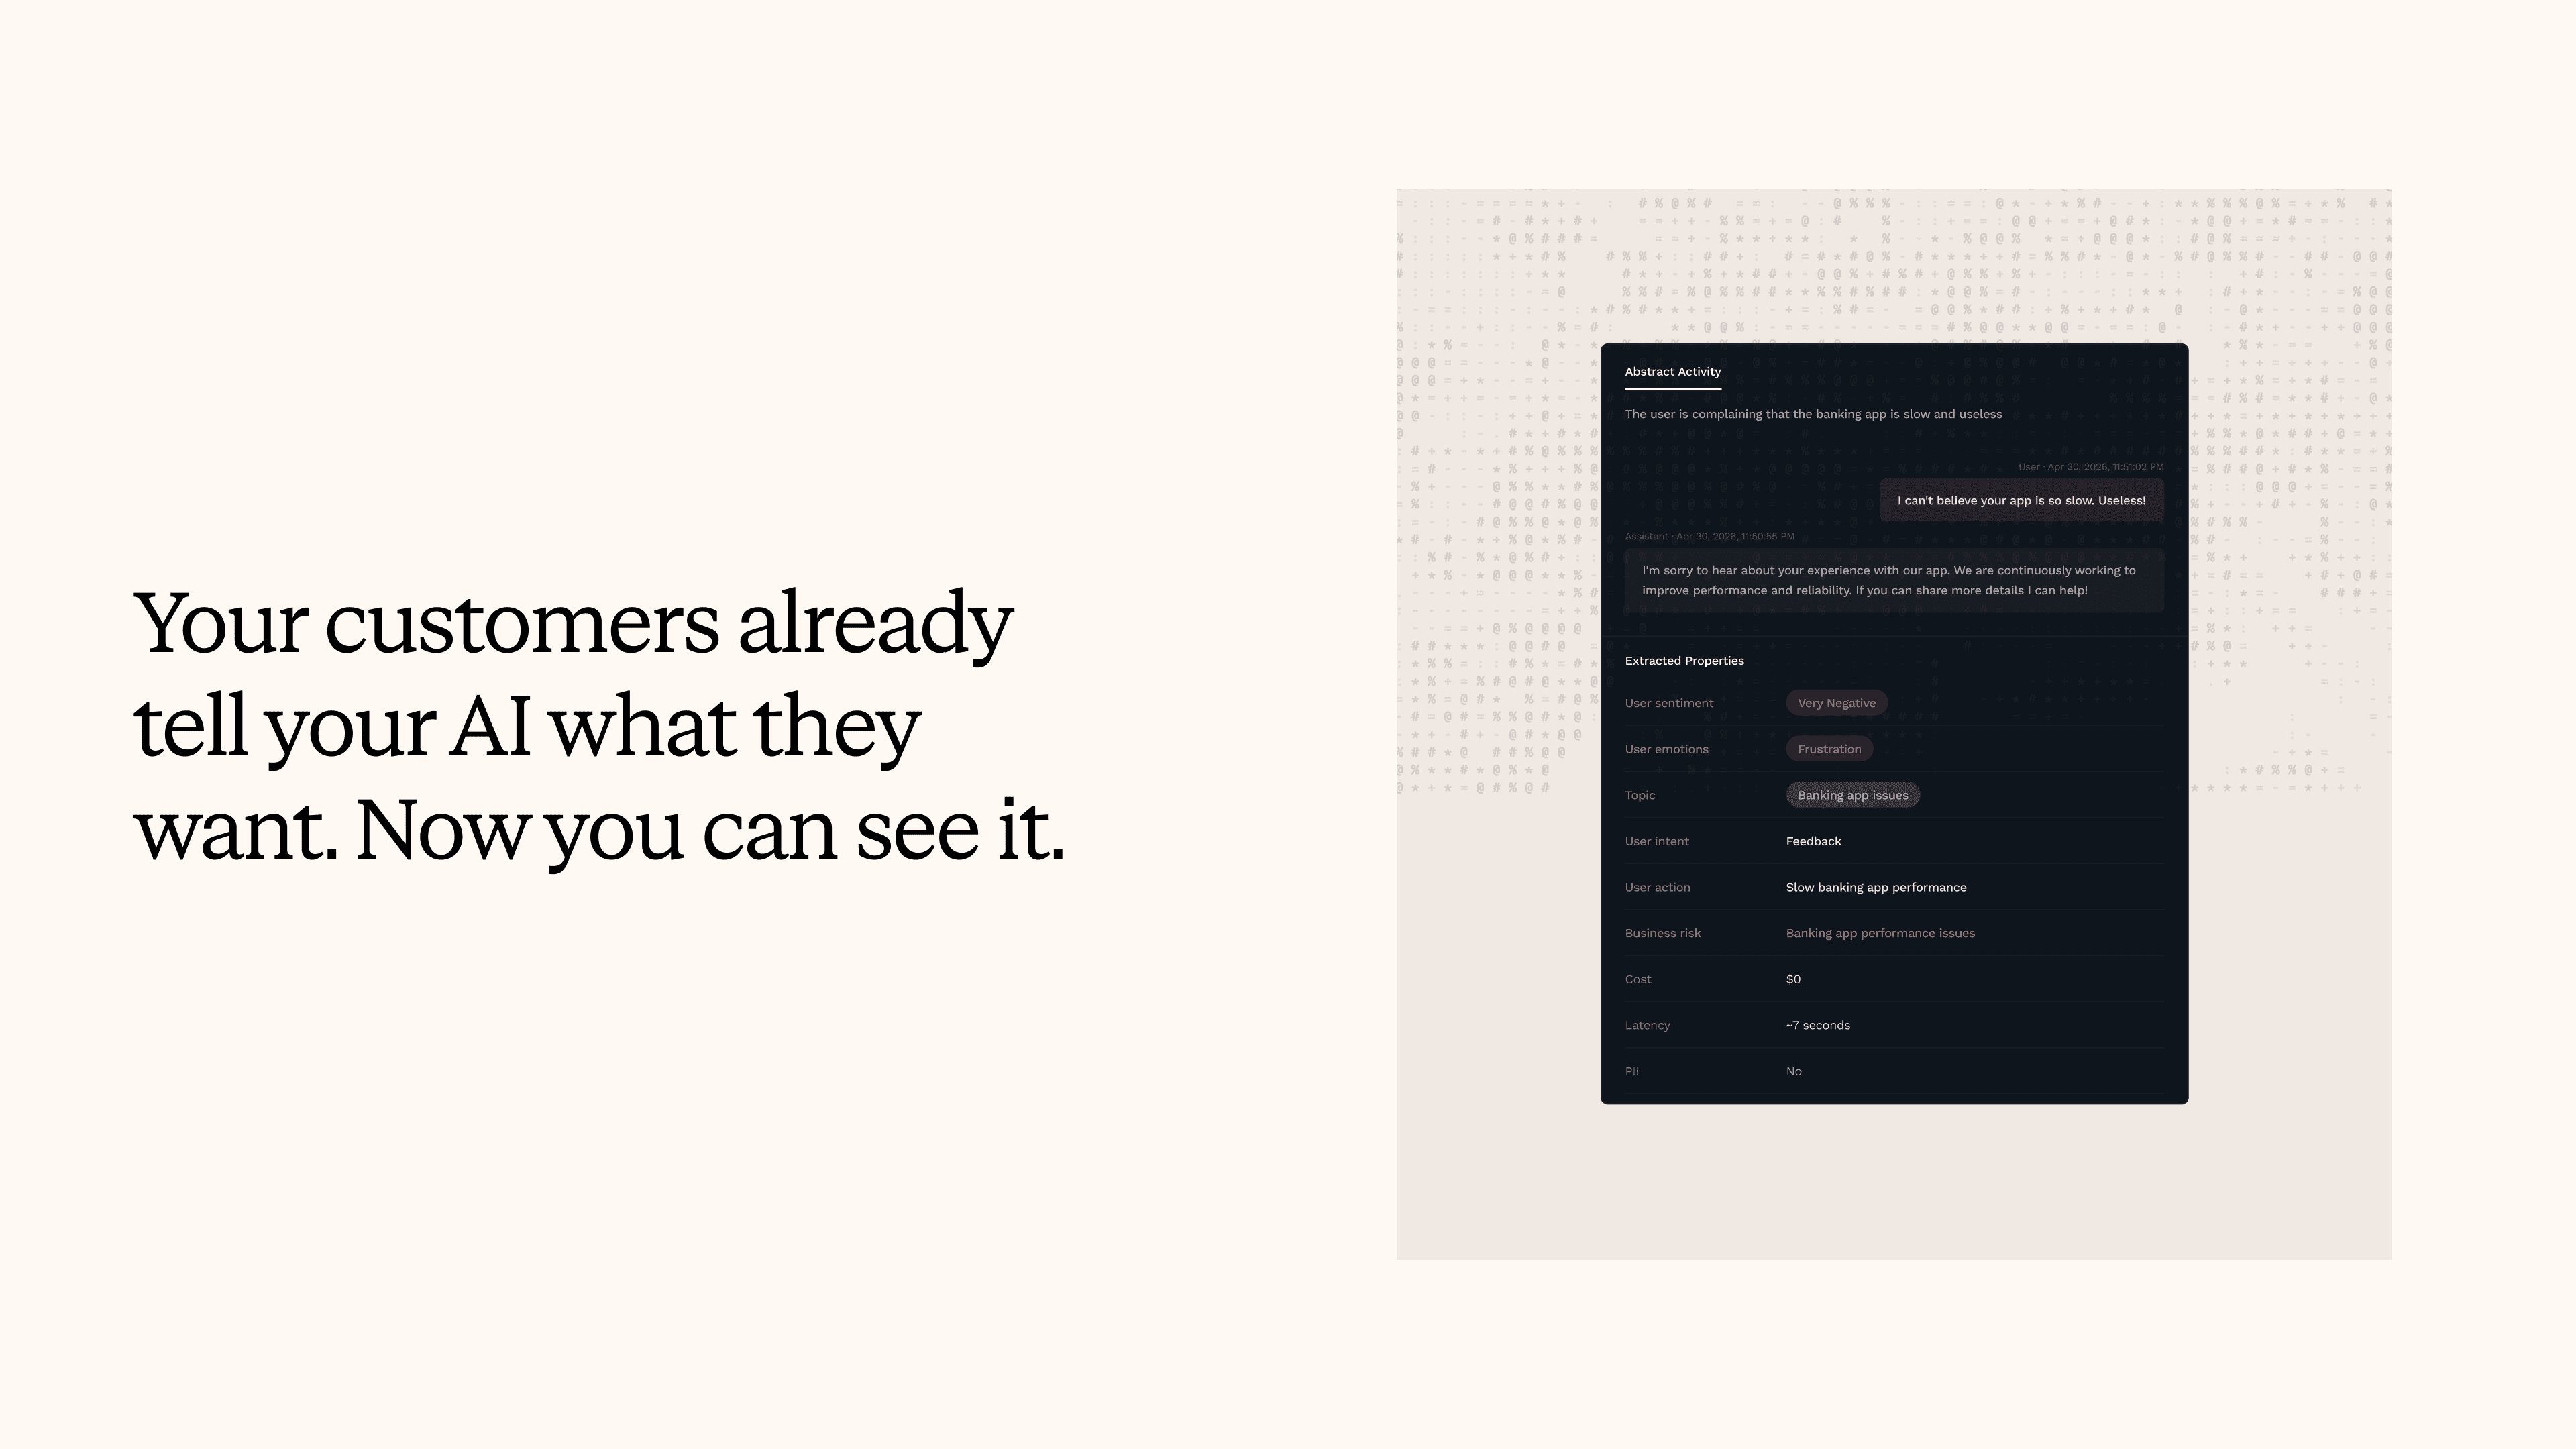
Enterprise AI agents operate in heavily regulated environments where compliance failures can result in significant financial penalties. Executive dashboards must surface risk indicators in real time, particularly for sensitive use cases in banking, healthcare, and manufacturing.
The most sophisticated organizations track "risk-weighted interactions", measuring not just what users ask AI agents but also flagging queries that might expose sensitive data, violate regulatory boundaries, or generate non-compliant responses. For example, a bank's AI assistant might show high adoption, but if it is inadvertently processing personal financial information without proper safeguards, that "success" metric becomes a liability. User behavior data reveals patterns that traditional security monitoring might miss. When healthcare workers consistently rephrase questions to work around AI limitations, it could indicate gaps in training data. When financial analysts ask similar questions repeatedly, it might signal that the agent is not providing sufficiently detailed responses for regulatory requirements.
Learn how Nebuly supports LLM security and compliance.
Pillar 3: business impact and ROI measurement
The most critical executive dashboard component connects AI agent usage to measurable business outcomes. This means linking user interaction data with downstream business metrics such as revenue attribution, cost savings, decision accuracy, and process efficiency gains.
In manufacturing, this might mean tracking how supply chain AI agents reduce inventory holding costs or prevent production delays. For retail, it involves measuring how personalization agents influence conversion rates, average order values, and customer lifetime value. Financial services organizations can track whether risk management agents help reduce loan defaults or improve audit results. The key is establishing causal relationships between AI agent interventions and business outcomes. User analytics platforms provide the behavioral layer connecting engagement patterns to performance improvements, enabling executives to quantify ROI with confidence.
At Nebuly, we just launched a new feature to track time saved by AI compared to human work, making it easy to quantify ROI in real terms. You can check how it works in our playground (no sign-up needed): in Reports, click add a new chart → analytics → variable (select ROI - hours saved). Then, group by department, geography (via tags), or any other category, and choose the best chart type for your data.
Pillar 4: user experience and satisfaction metrics
AI agents succeed when users trust them enough to change workflows. Executive dashboards need metrics that capture user sentiment, frustration points, and satisfaction levels, using implicit feedback signals rather than relying solely on traditional surveys. Advanced user analytics can detect frustration patterns, such as repeated rephrasing of questions, abandoned conversations, or escalation to human assistance. These signals act as early warnings to help prevent adoption stall.
For executives, this means understanding which AI implementations create genuine productivity improvements versus those that add friction to processes. In healthcare, for example, this might reveal that diagnostic agents are most helpful when integrated into EHR workflows, not as standalones.
Read this blog to learn what metrics to track.
Implementation strategy: from data to decisions
Building effective AI value dashboards demands a systematic approach balancing comprehensive measurement and actionable insight. The most successful initiatives start with clear executive questions: Which AI investments show the strongest ROI? Where are compliance risks emerging? How do different user segments engage with AI agents?
Organizations like Iveco Group and leading global banks have achieved success by implementing user analytics platforms to track conversational interactions, detect risk patterns, and surface business impact metrics in real time. These platforms sit between AI agents and users, automatically extracting behavioral signals and sharing them across unified executive dashboards.
The technical architecture matters less than the measurement framework. Whether in cloud or self-hosted for data protection, effective user analytics platforms provide role-based dashboards surfacing relevant insights for different stakeholders, from AI teams monitoring model performance to execs tracking business value.
If you’d like to see what our dashboard looks like, check out our playground.
Scaling across the enterprise
As AI agent deployments expand, dashboards must evolve. The goal is both high-level visibility and drill-down tools for leadership to investigate specific use cases or friction points. The best organizations create a feedback loop: dashboard insights guide agent training, model improvements, and new safeguards when fresh compliance risks or friction emerge.
Want to see how to build this dashboard for your specific use case? Book a demo with us.


Stay up to date on what we're learning, building, and seeing as enterprise teams deploy and measure AI agents in production.