From AI teams to AI everywhere: why every department now needs to prove its AI ROI
From AI teams to AI everywhere: why every department now needs to prove its AI ROI

TLDR
→ AI started centralized, just like the internet did. It is now in every department, running on different models, serving different use cases, and measured by different standards. → 88% of organizations use AI in at least one function. Only 39% report measurable financial impact. The gap is not a technology problem. It is a measurement problem. Medium → When every department runs its own AI agent, vendor dashboards only tell you whether the system is running. They cannot tell you whether it is generating value, or which agent in your portfolio is worth scaling. → The relevant measures vary by use case: hours saved for internal productivity tools, revenue influenced for customer-facing agents, AI proficiency growth for enablement programs. A unified framework captures all of them. → Only 1 in 5 companies has a mature governance model for autonomous AI agents. Portfolio-level visibility is also what makes AI compliance possible in regulated industries.
In the early days of the internet, most large enterprises had a dedicated "internet team." A small group of specialists built the website, owned the content strategy, and made the technology decisions. It seemed logical at the time. The internet was new, complex, and needed managing.
That model didn't last. Within a decade, every department ran its own digital programs. Marketing owned campaigns and traffic. HR recruited through digital platforms. Finance tracked performance through online dashboards. The internet became shared infrastructure, and the "internet team" became IT governance.
AI is following the same arc, and it is moving faster.
The shift is already happening
88% of organizations now use AI in at least one business function, up from 78% a year ago. In most of those organizations, AI started where the internet did: centralized, specialist-owned, carefully controlled. A central AI team chose the models, managed the integrations, and monitored technical performance. That made sense in the early stages. The technology was unfamiliar, the risks were real, and keeping everything in one place reduced the surface area for things to go wrong. (Medium)
But the use cases kept expanding. Enterprises spent $7.3 billion on departmental AI in 2025, up 4.1 times year over year, spread across coding, IT, marketing, customer success, design, and HR. Marketing teams spun up content agents. HR deployed onboarding assistants. Legal started using Claude for contract review. Sales adopted AI for research and qualification. Operations built custom agents on proprietary process data. (McKinsey & Company)
AI didn't stay with the AI team. It never does.
One organization, many AI agents
The result is that most large enterprises are now running a portfolio of AI agents across departments, each chosen by the team that uses it, each measured by different standards, and each reporting to different stakeholders.
Legal chose Claude because of its careful reasoning on contracts. Marketing uses ChatGPT for content generation. HR runs Copilot because it integrates with Microsoft 365. The customer support team built a custom agent on its own ticket data. Each decision is reasonable in isolation.
The problem is what happens when you zoom out.
When AI was one team's responsibility, you could monitor it in one place. When it is in every department, you have a portfolio problem. Legal cannot tell you whether their AI deployment is saving time. Marketing cannot quantify what their content agent is actually worth. HR has no idea whether the onboarding assistant changed anything measurable. Each team has an impression. Nobody has a number.
Only 39% of organizations report any enterprise-level financial impact from AI, despite near-universal deployment. Revenue growth from AI remains largely an aspiration: 74% of organizations want to grow revenue through AI, but only 20% are already doing so. The gap between "we have AI" and "we can show what it's worth" is where most enterprises are stuck. (MediumVena)
The web analytics parallel
This moment has a clear precedent. When every department got a website, a new problem emerged: how do you know which one is working? The answer was web analytics. A shared measurement layer that every department could use to understand what their digital presence was actually doing.
The same logic applies to AI. When every department runs an AI agent, you need a shared measurement layer that answers the same question across all of them: is this actually working, and what is it worth?
Without it, you are in exactly the position enterprises were in before web analytics existed. You know the websites are live. You have no idea which ones are driving value.
What "working" means by department
The measurement challenge is that different departments need to prove value in different ways. A unified AI ROI framework needs to handle all of them.
For internal productivity tools, the relevant measures are hours saved per employee, task completion rate, and AI proficiency over time. An internal legal AI agent that saves each lawyer 45 minutes a day on document review has a calculable value. An HR onboarding assistant that reduces time-to-productivity for new hires has a measurable impact. These are the numbers that justify the investment to a CFO.
For customer-facing AI agents, the relevant measures shift toward revenue signals: how many customer interactions are being resolved without escalation, what revenue is being influenced by AI-assisted conversations, and where satisfaction is declining in ways that predict churn. Enterprise users of AI report saving 40 to 60 minutes per day, and OpenAI's enterprise data shows AI contributing to measurable outcomes including revenue growth and improved customer experience. But those numbers only become visible when you measure at the interaction level, not just the system level. (Substack)
For leadership, the relevant question is across all of it: which AI agents are generating real return, which are being tolerated, and where should the next investment go.
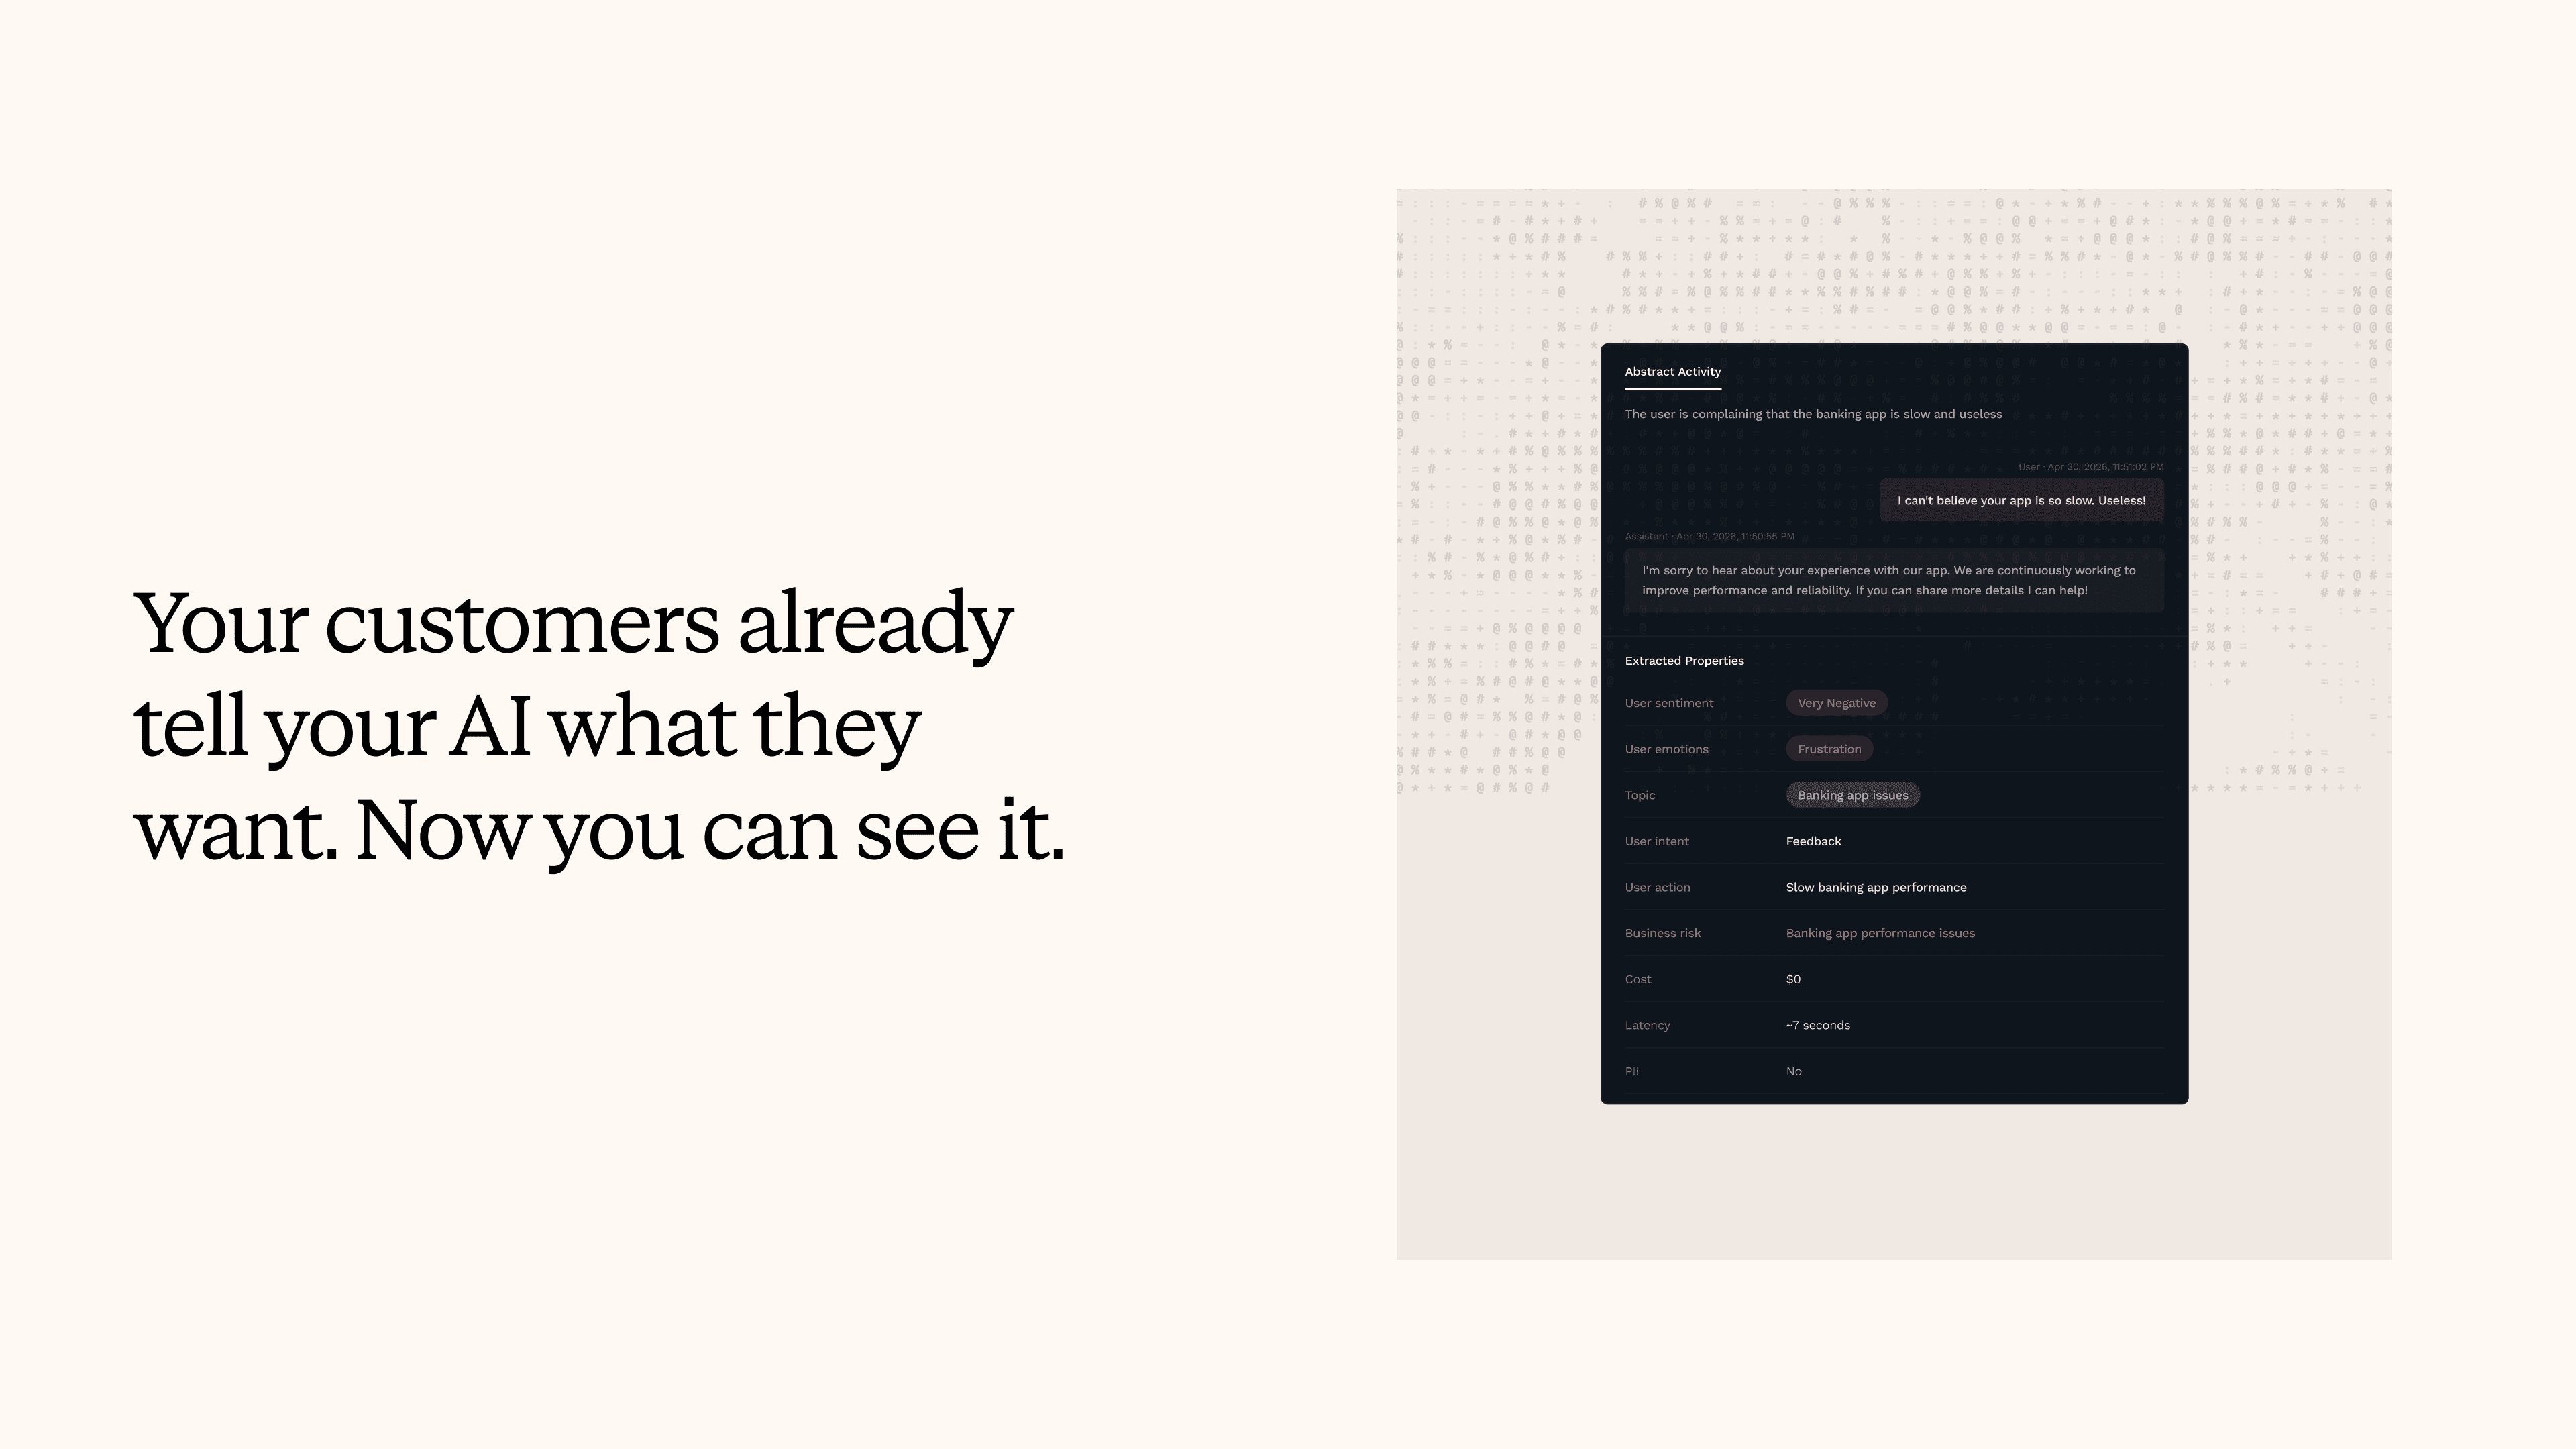
What you cannot see from vendor dashboards
Every AI vendor provides a dashboard. Those dashboards measure what the vendor's system does. Response time. Token consumption. Error rate. Uptime. These are useful for the engineering team managing the infrastructure. They are not useful for the department head trying to justify the budget line.
A customer support agent can handle thousands of queries a week with excellent technical metrics while failing to resolve most of them. An internal productivity tool can show high session counts while employees use it only for low-stakes tasks and avoid it for anything that matters. System dashboards will report both of these as healthy deployments.
What those dashboards cannot tell you is whether users accomplished what they came for, whether they came back, whether the AI is being used for the tasks that generate real business value, or whether one department's agent is dramatically outperforming another's and why.
That visibility only comes from measuring user behavior and outcomes across every agent in the portfolio, with a consistent methodology that makes comparison possible.
The governance question
Decentralized AI also creates governance exposure that most organizations have not fully addressed. Only one in five companies has a mature governance model for autonomous AI agents. When each department runs its own agents, the central AI or risk team loses visibility into how data is being used, which query categories are reaching sensitive domains, and whether individual agents are producing responses that create compliance risk. (Vena)
This is particularly consequential in regulated industries. Financial services, healthcare, and manufacturing organizations handle data subject to strict processing requirements. Knowing not just that a system ran, but what employees asked and how the agent responded, is the foundation of AI governance that satisfies audit and regulatory requirements. Individual vendor dashboards only see their own system. A portfolio-level view sees what actually matters for compliance.
Measuring AI ROI across the organization
The organizations closing the gap between AI deployment and measurable business impact are not necessarily using better models. They are measuring more deliberately.
They define success differently for each use case: hours saved for internal tools, revenue influenced for customer-facing agents, proficiency growth for training and enablement programs. They track these metrics consistently across every AI agent, not just for the most visible ones. And they report at the organizational level, so leadership can see the total return, which agents are earning their place, and where the next investment should go.
This is what transforms AI from a cost center with uncertain returns into a program with a defensible business case. Not the technology itself. The measurement layer on top of it.
Nebuly
Nebuly is the ROI platform for enterprise AI. It connects to the AI agents your business runs on, the assistants your customers interact with, and the tools your employees use every day, including Claude, ChatGPT, and Copilot, and translates that activity into business value. How much time is being saved across teams. What revenue your AI is influencing. What adoption and AI proficiency look like in practice, across departments and geographies. All aggregated at the organizational level, never tied to individuals.
If you need clarity on what your AI investment is actually delivering, book a demo.
FAQs
Why do most enterprises struggle to prove ROI from their AI investments?
Most enterprises measure AI at the system level: uptime, latency, error rates. These metrics tell you the technology is running. They do not tell you whether employees are saving time, whether customers are getting better service, or whether the AI is being used for tasks that generate real business value. Proving ROI requires measuring outcomes, not activity.
How do you measure AI ROI when different departments use different AI tools?
You need a measurement layer that sits above individual agents and applies a consistent set of metrics across all of them. For internal productivity tools, that means hours saved, task completion rate, and AI proficiency by team. For customer-facing agents, it means intent resolution rate, revenue influenced, and satisfaction signals. Measured consistently, these make it possible to compare agents directly and identify where the investment is generating return.
What is the difference between AI system monitoring and AI ROI measurement?
System monitoring tracks technical performance: whether the AI responded, how fast, at what cost. ROI measurement tracks business outcomes: whether employees accomplished what they came for, whether customers got answers that kept them engaged, how much time was saved, what revenue was influenced. System monitoring tells you the AI is working. ROI measurement tells you what it is worth.
How should enterprises govern AI agents across multiple departments?
Governance in a multi-agent environment requires visibility at the portfolio level, not just the system level. That means knowing what employees are asking across every AI agent, which query categories are reaching sensitive domains, and whether any department's AI usage patterns suggest compliance exposure. Individual vendor dashboards only see their own system. Effective governance requires a view across all of them, particularly in regulated industries where data processing obligations apply to every interaction.
What does AI proficiency mean and why does it matter for ROI?
AI proficiency measures how effectively employees are using AI agents to accomplish their actual work, not just whether they are logging in. It tracks whether usage deepens over time, whether employees are applying AI to high-value tasks or avoiding the ones that matter most, and whether different teams are developing at different rates. Organizations with high AI proficiency extract more value from the same tools. Proficiency growth by department is one of the clearest leading indicators of long-term AI ROI.


Stay up to date on what we're learning, building, and seeing as enterprise teams deploy and measure AI agents in production.